图像识别解决方案:使用Apache MXNet分类交通标志图像
2017年08月30日 由 xiaoshan.xiang 发表
226996
0
这个帖子的完整的Jupyter笔记本可以在这里访问。
有许多深度学习的框架,例如TensorFlow、Keras、Torch和Caffe,Apache MXNet由于其在多个GPU上的可伸缩性而受到欢迎。在这篇博文中,我们将解决一个计算机视觉问题:使用卷积神经网络对德国交通标志进行分类。该网络将包含交通标志图像的彩色照片作为输入,并试图识别交通标志的类型。
完整的笔记本可以在这里找到
为了完成这个笔记本,我们期望你对神经网络,卷积,激活单位,梯度下降,NumPy,OpenCV有一个非常基本的理解。这些先决条件不是强制性的,但是它会对以后的操作有所帮助。
在结束后,你可以:
准备一个训练神经网络的数据集;
生成和扩充数据以平衡数据集;
为多级分类问题实现自定义的神经网络架构。
如果你在AWS云中工作,可以使用Amazon Machine Image (AMI) 预先配置用于深度学习,从而避免安装管理。这将使你可以跳过下面的步骤1 - 5。
请注意,如果你使用的是conda环境,请记住在conda中安装pip,在激活环境后输入“conda install pip”。这一步将为你省去很多问题。
下面是建立过程:
以下是你需要在anaconda环境中键入的命令(在激活环境后):
我们需要数据了解深度层神经网络。对于该笔记本,我们使用已经存储为NumPy数组的数据集。你还可以从任何图像文件中加载数据。我们稍后会在笔记本上展示这个过程。
我们将使用的数据集是德国交通标志识别基准(j . Stallkamp,m . Schlipsing,j . Salmen和c . Igel)。德国交通标志识别基准:多级分类竞赛。《IEEE神经网络国际联合会议论文集》,1453 - 1460页。2011年)。
该数据集包含39,209个训练样本和12630个测试样本,代表43个不同的交通标志如停止标志,速度限制,各种警告标志,等等)。
我们将使用数据的pickled版本,training.p和valid.p。
数据集中的每一个图像都是32 * 32的尺寸,有三个通道(RGB)颜色,它属于一个特定的图像类别。图像类别是0到43之间的整数标签。“signnames.csv”文件包含符号名称和类标签之间的映射。
下面是加载数据的代码:
我们正在从已存储的NumPy数组中加载数据。在这个数组中,数据在训练集、验证集和测试集之间进行分配。训练集包含39,209个尺寸为32 X 32的图像的特征,有3个(R,G,B)通道。因此,NumPy数组维度是39,209 X 32 X 32 X 3。我们只会使用该笔记本的训练集和验证集。我们将使用来自互联网的真实图像来测试我们的模型。
所以X_train的尺寸为39,209 * 32 X 32 X 3。y_train的尺寸为39,209,每幅图像的数字在0 - 43之间。
接下来,我们加载将每个图像类别的ID映射到自然语言名称的文件:
我们可以看见43个图像类别对应的43个标签,例如,0图像类别代表限速20 km/h
接下来的代码将会帮助我们可视化带有标签(图像类别)的图像
这有一些交通标志的图片。
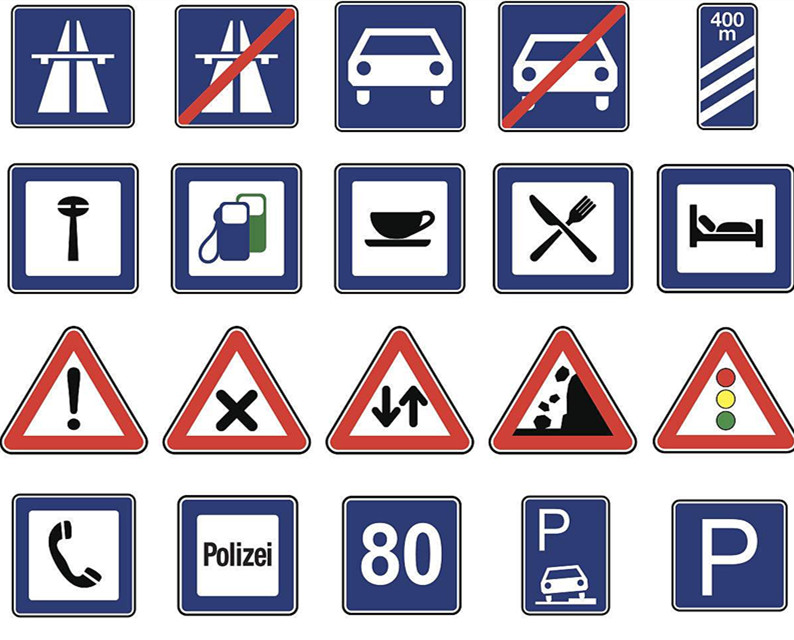
X_train 和 Y_train组成训练数据集。我们使用真实的图片进行测验。
你还可以通过使用scikit- learn将训练数据拆分为训练和验证集,从而生成验证集(这就是如何避免在已经看到的图像上测试模型)。下面是Python代码。
MXNet的图像维度顺序类似于Theano,使用的格式是3X32X32。通道的数量是第一维度,其次是图像的高度和宽度。TensorFlow使用了32X32X3的图像维度排序。颜色频道是最后的。如果你从TensorFlow切换到MXNet,那么关于维度排序的讨论可能会有所帮助。下面是将图像的排序转换为MXNet的3X32X32格式的帮助函数,从32X32X3开始:
现在,我们准备的数据集已经足够了,让我们来编码神经网络。你会注意到一些被注释的行;我把这些作为开发过程中的工件——迭代和实验是构建一个成功的深度学习模型的最有效的方法。建立神经网络在历史上是一种黑人艺术;虽然你可能会尝试解决特定的问题,但对于像图像识别这样经过充分研究的问题,应尽力实现已经发布的体系结构,并证明其性能。在这里,我们将建立一个基于卷积神经网络的简化版的AlexNet架构。
由于MXNet的符号API,神经代码简洁明了。
稍微分解一下代码。首先,它创建一个数据层(输入层),这实际上在训练时保存数据集:
conv1层在图像上执行卷积算子,与数据层相连:
在输入端,relu2层执行非线性激活,与卷积1层连接:
在上一层的输出(relu2)上,最大池层执行池操作(删除一些像素和减小图像尺寸)。
神经网络就像乐高积木块——我们可以很容易地重复一些层(增加模型的学习能力),然后用一个致密层来跟踪它们。致密层是一个完全连通的层,在这个层中,前一层的每个神经元都与致密层中的每个神经元相连接。
这一层又被一个完全连通的层与43个神经元相连,每个神经元代表一个图像的类别。由于神经元的输出是实值的,但是我们的分类需要一个标签作为输出,所以我们使用另一个激活函数。这一步使一个特定神经元的输出(从43个神经元中取出)为1,其余的神经元为零。
神经网络需要大量的时间和记忆来训练。我们将把我们的数据分成64个小部分,不仅是为了让它们更适合内存,还因为它使MXNet能够充分利用GPU的计算效率(还有其他原因)。
我们还将图像颜色(0 - 255)的值规范化为0到1的范围。这有助于学习算法收敛得更快。你可以阅读关于规范输入的理由 。
下面是规范图像颜色值的代码:
我们正在使用GPU训练神经网络。训练集的单一通道被称为“epoch”,我们正在训练10个epoch“num_epoch = 10”的神经网络。我们还定期在JSON文件中存储训练的模型,并测量训练和验证的准确性,以查看我们的神经网络的“学习”。
这是代码:
由于我们在训练中对模型进行了校验,我们可以加载任何一个epoch,并检查其分类能力。在下面的例子中,我们加载了第10个epoch。我们还将在模型中的绑定设置为false,因为我们使用这个网络进行测试,而不是训练。此外,我们减少了输入从64到1的批处理大小(data_UNK =[' data ',(' data ',1,3,32,32)),因为我们将在单个图像上进行测试。
你可以使用同样的技术来加载任何其他预先训练的机器学习模型:
为了使用加载的模型进行预测,我们将一个交通标志图像(stop. jpg)转换为32 32 3(3个通道的32 * 32维图像,),并试图预测它们的标签。这是我下载的图片。

然后我们得到模型对于这个图像的前5个预测,发现我们的模型是正确的。
预测:
类=停止
类=限速(30公里/小时)
类=限速(20公里/小时)
类=速度限制(70公里/小时)
类=自行车穿越
在该笔记本中,我们探讨了如何使用MXNet执行多类图像分类。虽然我们构建的网络比最复杂的图像识别神经网络体系结构简单,但即使是这个简单版本的性能也令人感到惊讶。我们还学习了预处理图像数据的技术,我们训练了神经网络并将训练过的神经网络存储在磁盘上。之后,我们加载了预训练的神经网络模型来对图像进行分类。这个模型可以作为网络服务器或应用程序的部署(你可以构建自己的“ what-dog !”)。你也可以使用这些技术分类其他数据,可以在你的帮助台上分析情绪和意图,或发现金融行为的非法意图。
有许多深度学习的框架,例如TensorFlow、Keras、Torch和Caffe,Apache MXNet由于其在多个GPU上的可伸缩性而受到欢迎。在这篇博文中,我们将解决一个计算机视觉问题:使用卷积神经网络对德国交通标志进行分类。该网络将包含交通标志图像的彩色照片作为输入,并试图识别交通标志的类型。
完整的笔记本可以在这里找到
为了完成这个笔记本,我们期望你对神经网络,卷积,激活单位,梯度下降,NumPy,OpenCV有一个非常基本的理解。这些先决条件不是强制性的,但是它会对以后的操作有所帮助。
在结束后,你可以:
准备一个训练神经网络的数据集;
生成和扩充数据以平衡数据集;
为多级分类问题实现自定义的神经网络架构。
准备环境
如果你在AWS云中工作,可以使用Amazon Machine Image (AMI) 预先配置用于深度学习,从而避免安装管理。这将使你可以跳过下面的步骤1 - 5。
请注意,如果你使用的是conda环境,请记住在conda中安装pip,在激活环境后输入“conda install pip”。这一步将为你省去很多问题。
下面是建立过程:
- 首先,找一个软件包管理器Anaconda。它将帮助你轻松地安装相关的Python库。
- 安装opencv - python库,它是一个强大的计算机视觉库。我们将使用它来处理我们的图像。要在Anaconda环境中安装OpenCV,请使用“pipinstall OpenCV - python”。你还可以从源代码构建。(注意:conda安装opencv3.0不工作。)
- 接下来,安装scikit learn,它是一个通用的科学计算库。我们将使用它预处理我们的数据。你可以使用“condainstall scikit-learn”来安装它。
- 然后获取安装了conda的Jupyter笔记本。
- 最后,获取开放源码的深度学习库MXNet。
以下是你需要在anaconda环境中键入的命令(在激活环境后):
- conda install pip
- pip install opencv-python
- conda install scikit-learn
- conda install jupyter notebook
- pip install mxnet
数据集
我们需要数据了解深度层神经网络。对于该笔记本,我们使用已经存储为NumPy数组的数据集。你还可以从任何图像文件中加载数据。我们稍后会在笔记本上展示这个过程。
我们将使用的数据集是德国交通标志识别基准(j . Stallkamp,m . Schlipsing,j . Salmen和c . Igel)。德国交通标志识别基准:多级分类竞赛。《IEEE神经网络国际联合会议论文集》,1453 - 1460页。2011年)。
该数据集包含39,209个训练样本和12630个测试样本,代表43个不同的交通标志如停止标志,速度限制,各种警告标志,等等)。
我们将使用数据的pickled版本,training.p和valid.p。
数据集中的每一个图像都是32 * 32的尺寸,有三个通道(RGB)颜色,它属于一个特定的图像类别。图像类别是0到43之间的整数标签。“signnames.csv”文件包含符号名称和类标签之间的映射。
下面是加载数据的代码:
import pickle


# TODO: Fill this in based on where you saved the training and testing data

training_file = "traffic-data/train.p"

validation_file =  "traffic-data/valid.p"


with open(training_file, mode='rb') as f:

    train = pickle.load(f)


with open(validation_file, mode='rb') as f:

    valid = pickle.load(f)


X_train, y_train = train['features'], train['labels']

X_valid, y_valid = valid['features'], valid['labels']
我们正在从已存储的NumPy数组中加载数据。在这个数组中,数据在训练集、验证集和测试集之间进行分配。训练集包含39,209个尺寸为32 X 32的图像的特征,有3个(R,G,B)通道。因此,NumPy数组维度是39,209 X 32 X 32 X 3。我们只会使用该笔记本的训练集和验证集。我们将使用来自互联网的真实图像来测试我们的模型。
所以X_train的尺寸为39,209 * 32 X 32 X 3。y_train的尺寸为39,209,每幅图像的数字在0 - 43之间。
接下来,我们加载将每个图像类别的ID映射到自然语言名称的文件:
# The actual name of the classes are given in a separate file. Here we load the csv file which allows mapping from classes/labels to

# file name

import csv

def read_csv_and_parse():

    traffic_labels_dict ={}

    with open('signnames.csv') as f:

        reader = csv.reader(f)

        count = -1;

        for row in reader:

            count = count + 1

            if(count == 0):

                continue

            label_index = int(row[0])

            traffic_labels_dict[label_index] = row[1]

    return traffic_labels_dict

traffic_labels_dict = read_csv_and_parse()

print(traffic_labels_dict)
我们可以看见43个图像类别对应的43个标签,例如,0图像类别代表限速20 km/h
{0: 'Speed limit (20km/h)', 1: 'Speed limit (30km/h)', 2: 'Speed limit (50km/h)', 3: 'Speed limit (60km/h)', 4: 'Speed limit (70km/h)', 5: 'Speed limit (80km/h)', 6: 'End of speed limit (80km/h)', 7: 'Speed limit (100km/h)', 8: 'Speed limit (120km/h)', 9: 'No passing', 10: 'No passing for vehicles over 3.5 metric tons', 11: 'Right-of-way at the next intersection', 12: 'Priority road', 13: 'Yield', 14: 'Stop', 15: 'No vehicles', 16: 'Vehicles over 3.5 metric tons prohibited', 17: 'No entry', 18: 'General caution', 19: 'Dangerous curve to the left', 20: 'Dangerous curve to the right', 21: 'Double curve', 22: 'Bumpy road', 23: 'Slippery road', 24: 'Road narrows on the right', 25: 'Road work', 26: 'Traffic signals', 27: 'Pedestrians', 28: 'Children crossing', 29: 'Bicycles crossing', 30: 'Beware of ice/snow', 31: 'Wild animals crossing', 32: 'End of all speed and passing limits', 33: 'Turn right ahead', 34: 'Turn left ahead', 35: 'Ahead only', 36: 'Go straight or right', 37: 'Go straight or left', 38: 'Keep right', 39: 'Keep left', 40: 'Roundabout mandatory', 41: 'End of no passing', 42: 'End of no passing by vehicles over 3.5 metric tons'}可视化
接下来的代码将会帮助我们可视化带有标签(图像类别)的图像
# Exploratory data visualization

# This gives a better, intuitive understanding of the data


import matplotlib.pyplot as plt

from matplotlib.figure import Figure

# Visualizations will be shown in the notebook.

%matplotlib inline


#This functions selects one image per class to plot

def get_images_to_plot(images, labels):

    selected_image = []

    idx = []

    for i in range(n_classes):

        selected = np.where(labels == i)[0][0]

        selected_image.append(images[selected])

        idx.append(selected)

    return selected_image,idx


# function to plot the images in a grid

def plot_images(selected_image,y_val,row=5,col=10,idx = None):

    count =0;

    f, axarr = plt.subplots(row, col,figsize=(50, 50))


    for i in range(row):

         for j in range(col):

                if(count < len(selected_image)):

                    axarr[i,j].imshow(selected_image[count])

                    if(idx != None):

                        axarr[i,j].set_title(traffic_labels_dict[y_val[idx[count]]], fontsize=20)

                axarr[i,j].axis('off')

                count = count + 1


selected_image,idx = get_images_to_plot(X_train,y_train)

plot_images(selected_image,row=10,col=4,idx=idx,y_val=y_train)
这有一些交通标志的图片。

准备数据集
X_train 和 Y_train组成训练数据集。我们使用真实的图片进行测验。
你还可以通过使用scikit- learn将训练数据拆分为训练和验证集,从而生成验证集(这就是如何避免在已经看到的图像上测试模型)。下面是Python代码。
#split the train-set as validation and test set

from sklearn.model_selection import train_test_split

X_train_set,X_validation_set,Y_train_set,Y_validation_set = train_test_split( X_train, Y_train, test_size=0.02, random_state=42)
MXNet的图像维度顺序类似于Theano,使用的格式是3X32X32。通道的数量是第一维度,其次是图像的高度和宽度。TensorFlow使用了32X32X3的图像维度排序。颜色频道是最后的。如果你从TensorFlow切换到MXNet,那么关于维度排序的讨论可能会有所帮助。下面是将图像的排序转换为MXNet的3X32X32格式的帮助函数,从32X32X3开始:
#change the image dimensioning from 32 X 32 X 3 to 3 X 32 X 32 for train

X_train_reshape = np.transpose(X_train, (0, 3, 1, 2))

plt.imshow(X_train_reshape[0].transpose((1,2,0)))

print(X_train_reshape.shape)


#change the image dimensioning from 32 X 32 X 3 to 3 X 32 X 32 for validation

X_valid_reshape = np.transpose(X_valid, (0, 3, 1, 2))

plt.imshow(X_valid_reshape[1].transpose((1,2,0)))

print(X_valid_reshape.shape)
构建deepnet
现在,我们准备的数据集已经足够了,让我们来编码神经网络。你会注意到一些被注释的行;我把这些作为开发过程中的工件——迭代和实验是构建一个成功的深度学习模型的最有效的方法。建立神经网络在历史上是一种黑人艺术;虽然你可能会尝试解决特定的问题,但对于像图像识别这样经过充分研究的问题,应尽力实现已经发布的体系结构,并证明其性能。在这里,我们将建立一个基于卷积神经网络的简化版的AlexNet架构。
由于MXNet的符号API,神经代码简洁明了。
data = mx.symbol.Variable('data')

conv1 = mx.sym.Convolution(data=data, pad=(1,1), kernel=(3,3), num_filter=24, name="conv1")

relu1 = mx.sym.Activation(data=conv1, act_type="relu", name= "relu1")

pool1 = mx.sym.Pooling(data=relu1, pool_type="max", kernel=(2,2), stride=(2,2),name="max_pool1")

# second conv layer

conv2 = mx.sym.Convolution(data=pool1, kernel=(3,3), num_filter=48, name="conv2", pad=(1,1))

relu2 = mx.sym.Activation(data=conv2, act_type="relu", name="relu2")

pool2 = mx.sym.Pooling(data=relu2, pool_type="max", kernel=(2,2), stride=(2,2),name="max_pool2")


conv3 = mx.sym.Convolution(data=pool2, kernel=(5,5), num_filter=64, name="conv3")

relu3 = mx.sym.Activation(data=conv3, act_type="relu", name="relu3")

pool3 = mx.sym.Pooling(data=relu3, pool_type="max", kernel=(2,2), stride=(2,2),name="max_pool3")


#conv4 = mx.sym.Convolution(data=conv3, kernel=(5,5), num_filter=64, name="conv4")

#relu4 = mx.sym.Activation(data=conv4, act_type="relu", name="relu4")

#pool4 = mx.sym.Pooling(data=relu4, pool_type="max", kernel=(2,2), stride=(2,2),name="max_pool4")


# first fullc layer

flatten = mx.sym.Flatten(data=pool3)

fc1 = mx.symbol.FullyConnected(data=flatten, num_hidden=500, name="fc1")

relu3 = mx.sym.Activation(data=fc1, act_type="relu" , name="relu3")

# second fullc

fc2 = mx.sym.FullyConnected(data=relu3, num_hidden=43,name="final_fc")

# softmax loss

mynet = mx.sym.SoftmaxOutput(data=fc2, name='softmax')
稍微分解一下代码。首先,它创建一个数据层(输入层),这实际上在训练时保存数据集:
data = mx.symbol.Variable('data')conv1层在图像上执行卷积算子,与数据层相连:
conv1 = mx.sym.Convolution(data=data, pad=(1,1), kernel=(3,3), num_filter=24, name="conv1")
在输入端,relu2层执行非线性激活,与卷积1层连接:
relu2 = mx.sym.Activation(data=conv2, act_type="relu", name="relu2")
在上一层的输出(relu2)上,最大池层执行池操作(删除一些像素和减小图像尺寸)。
pool2 = mx.sym.Pooling(data=relu2, pool_type="max", kernel=(2,2), stride=(2,2),name="max_pool2")
神经网络就像乐高积木块——我们可以很容易地重复一些层(增加模型的学习能力),然后用一个致密层来跟踪它们。致密层是一个完全连通的层,在这个层中,前一层的每个神经元都与致密层中的每个神经元相连接。
fc1 = mx.symbol.FullyConnected(data=flatten, num_hidden=500, name="fc1")
这一层又被一个完全连通的层与43个神经元相连,每个神经元代表一个图像的类别。由于神经元的输出是实值的,但是我们的分类需要一个标签作为输出,所以我们使用另一个激活函数。这一步使一个特定神经元的输出(从43个神经元中取出)为1,其余的神经元为零。
fc2 = mx.sym.FullyConnected(data=relu3, num_hidden=43,name="final_fc")

# softmax loss

mxnet = mx.sym.SoftmaxOutput(data=fc2, name='softmax')
调整训练数据
神经网络需要大量的时间和记忆来训练。我们将把我们的数据分成64个小部分,不仅是为了让它们更适合内存,还因为它使MXNet能够充分利用GPU的计算效率(还有其他原因)。
我们还将图像颜色(0 - 255)的值规范化为0到1的范围。这有助于学习算法收敛得更快。你可以阅读关于规范输入的理由 。
下面是规范图像颜色值的代码:
batch_size = 64

X_train_set_as_float = X_train_reshape.astype('float32')

X_train_set_norm = X_train_set_as_float[:] / 255.0;


X_validation_set_as_float = X_valid_reshape.astype('float32')

X_validation_set_norm = X_validation_set_as_float[:] / 255.0 ;


train_iter =mx.io.NDArrayIter(X_train_set_as_float, y_train_extra, batch_size, shuffle=True)

val_iter = mx.io.NDArrayIter(X_validation_set_as_float, y_valid, batch_size,shuffle=True)


print("train set : ", X_train_set_norm.shape)

print("validation set : ", X_validation_set_norm.shape)


print("y train set : ", y_train.shape)

print("y validation set :", y_valid.shape)
训练神经网络
我们正在使用GPU训练神经网络。训练集的单一通道被称为“epoch”,我们正在训练10个epoch“num_epoch = 10”的神经网络。我们还定期在JSON文件中存储训练的模型,并测量训练和验证的准确性,以查看我们的神经网络的“学习”。
这是代码:
#create adam optimiser

adam = mx.optimizer.create('adam')


#checking point (saving the model). Make sure there is folder named models exist

model_prefix = 'models/chkpt'

checkpoint = mx.callback.do_checkpoint(model_prefix)


#loading the module API. Previously mxnet used feedforward (deprecated)

model =  mx.mod.Module(

    context = mx.gpu(0),     # use GPU 0 for training if you dont have gpu use mx.cpu().

    symbol = mynet,

    data_names=['data']

   )


#actually fit the model for 10 epochs. Can take 5 minutes

model.fit(

    train_iter,

    eval_data=val_iter,

    batch_end_callback = mx.callback.Speedometer(batch_size, 64),

    num_epoch = 10,

    eval_metric='acc', # evaluation metric is accuracy.

    optimizer = adam,

    epoch_end_callback=checkpoint

)
从文件系统加载经过训练的模型
由于我们在训练中对模型进行了校验,我们可以加载任何一个epoch,并检查其分类能力。在下面的例子中,我们加载了第10个epoch。我们还将在模型中的绑定设置为false,因为我们使用这个网络进行测试,而不是训练。此外,我们减少了输入从64到1的批处理大小(data_UNK =[' data ',(' data ',1,3,32,32)),因为我们将在单个图像上进行测试。
你可以使用同样的技术来加载任何其他预先训练的机器学习模型:
#load the model from the checkpoint , we are loading the 10 epoch

sym, arg_params, aux_params = mx.model.load_checkpoint(model_prefix, 10)


# assign the loaded parameters to the module

mod = mx.mod.Module(symbol=sym, context=mx.cpu())

mod.bind(for_training=False, data_shapes=[('data', (1,3,32,32))])

mod.set_params(arg_params, aux_params)
预测
为了使用加载的模型进行预测,我们将一个交通标志图像(stop. jpg)转换为32 32 3(3个通道的32 * 32维图像,),并试图预测它们的标签。这是我下载的图片。

#Prediction for random traffic sign from internet

from collections import namedtuple

Batch = namedtuple('Batch', ['data'])


#load the image , resizes it to 32*32 and converts it to 1*3*32*32

def get_image(url, show=False):

    # download and show the image

    img =cv2.imread(url)

    img = cv2.cvtColor(img, cv2.COLOR_BGR2RGB)

    if img is None:

         return None

    if show:

         plt.imshow(img)

         plt.axis('off')

    # convert into format (batch, RGB, width, height)

    img = cv2.resize(img, (32, 32))

    img = np.swapaxes(img, 0, 2)

    img = np.swapaxes(img, 1, 2) #swaps axis to make it 3*32*32

    #plt.imshow(img.transpose(1,2,0))

    #plt.axis('off')

    img = img[np.newaxis, :] # Add a extra axis to the image so it becomes 1*3*32*32

    return img


def predict(url):

    img = get_image(url, show=True)

    # compute the predict probabilities

    mod.forward(Batch([mx.nd.array(img)]))

    prob = mod.get_outputs()[0].asnumpy()

    # print the top-5

    prob = np.squeeze(prob)

    prob = np.argsort(prob)[::-1]

    for i in prob[0:5]:

        print('class=%s' %(traffic_labels_dict[i]))


predict('traffic-data/Stop.jpg',)
然后我们得到模型对于这个图像的前5个预测,发现我们的模型是正确的。
预测:
类=停止
类=限速(30公里/小时)
类=限速(20公里/小时)
类=速度限制(70公里/小时)
类=自行车穿越
结论
在该笔记本中,我们探讨了如何使用MXNet执行多类图像分类。虽然我们构建的网络比最复杂的图像识别神经网络体系结构简单,但即使是这个简单版本的性能也令人感到惊讶。我们还学习了预处理图像数据的技术,我们训练了神经网络并将训练过的神经网络存储在磁盘上。之后,我们加载了预训练的神经网络模型来对图像进行分类。这个模型可以作为网络服务器或应用程序的部署(你可以构建自己的“ what-dog !”)。你也可以使用这些技术分类其他数据,可以在你的帮助台上分析情绪和意图,或发现金融行为的非法意图。

欢迎关注ATYUN官方公众号
商务合作及内容投稿请联系邮箱:bd@atyun.com
热门企业
热门职位
写评论取消
回复取消


