消灭假新闻:使用Scikit-Learn检测虚假新闻
2017年09月10日 由 xiaoshan.xiang 发表
523895
0
检测假新闻不是一项容易的任务,首先,要定义是什么是假新闻。你需要找到一个关于虚假新闻的定义,而且必须正确地对真实和虚假的新闻进行标签(希望在类似的话题上能表现出明显的区别)。
为了进一步了解这个问题,我推荐Miguel Martinez-Alvarez的文章“如何利用机器学习和AI解决虚假新闻问题”(链接地址为https://miguelmalvarez.com/2017/03/23/how-can-machine-learning-and-ai-help-solving-the-fake-news-problem/)”。
与此同时,我读了米格尔的文章,偶然发现了一个公开的数据科学的帖子用“贝叶斯模型构建一个成功的虚假新闻检测器”(链接地址为https://opendatascience.com/blog/how-to-build-a-fake-news-classification-model/),这个作者甚至创建了带有标记的真假新闻示例数据集的储存库。
在这篇文章中,你将看到我最初的一些探索,也可以看看自己是否可以创建一个成功的虚假新闻检测器。

首先,你应该快速浏览数据并且对它的内容有一个大概的了解,使用Pandas数据框架并且检查形状、磁头和应用必要的转换。


现在的数据框架看起来和需要的很接近,你需要去分离标签并设置训练和培训数据集。
对于该笔记本,我决定使用更长的文章文本,因为我将使用字袋和文档频率(TF-IDF)提取特性,这似乎是一个很好的选择。使用更长的文本有可能为假新闻数据提供明显的词汇和特性。


现在已经有了自己的训练和测试数据集,你就可以创建自己的分类器。为了更好地了解文章中的单词和标记是否对新闻的真假有重大影响,首先要使用CountVectorizer和TfidfVectorizer。
这个示例对于使用max_df参数的TF-IDF向量化程序tfidf_vectorizer,将一个最大的阈值设置为.7。这删除了超过70%的文章中出现的单词。此外,内置的stop_words参数将在生成向量之前从数据中删除英语停用词。
有更多的参数可用,你可以在scikit- learn文档中阅读所有关于TfidfVectorizer和CountVectorizer的文档。


现在已经有了向量,你可以研究存储在count_vectorizer和tfidf_vectorizer中的向量特性。
在你所使用的数据集中,有很明显的注释、度量或其他无意义的词以及多语种文章。通常情况下,你需要花更多的时间来处理这个问题和消除噪声,但是本教程只是展示了一个概念的小证明,你将看到模型能否克服这些噪声并正确地分类。


我很好奇我的计数和TF-IDF向量化程序是否提取了不同的标记。为了查看和比较特性,你可以将向量信息提取到数据框架以使用简单的Python比较。
通过运行下面的单元格,两个向量化程序都提取了相同的标记,显然这两个标记的权重不同。改变TF-IDF向量化程序的max_df和min_df可能会改变结果,使每个结果具有不同特性。
5行×56922列
5行×56922列
现在是时候训练和测试模型了。
将从NLP最喜欢的MultinomialNB开始。你可以使用它来比较TF-IDF和字袋。CountVectorizer的表现会更好。(有关多项式分布的更多阅读以及为什么最好使用整数,请查看UPenn统计学课程中的简洁说明)。
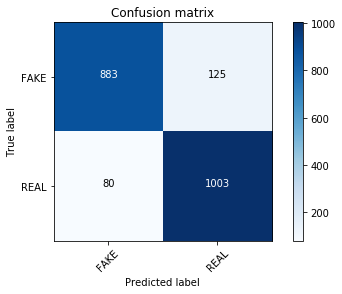
我个人觉得confusion matrices更容易比较和阅读,所以我使用scikit-learn文档来构建一些易于阅读的confusion matrices(谢谢开源!)。用confusion matrices显示主对角线上的正确标签(左上角到右下角)。其他单元格显示不正确的标签,通常称为假阳性或假阴性。
除了confusion matrices之外,scikit-learn有许多方法来可视化和比较模型。一种比较受欢迎的方式是使用“ROC”(链接地址为http://scikit-learn.org/stable/auto_examples/model_selection/plot_roc_crossval.html)曲线。在 “scikit-learn指标模块”(链接地址为https://www.atyun.com/wp-admin/post.php?post=5499&action=edit#sklearn-metrics-metrics)还有很多其他方法评估模型的可用性。


实际上,没有进行参数调整,计数向量训练集count_train就已经明显优于TF-IDF向量。
关于线性模型如何与TF-IDF向量化程序协调工作,有很多非常好的报道(查看“word2vec”(链接地址为http://nadbordrozd.github.io/blog/2016/05/20/text-classification-with-word2vec/)的分类,scikit-learn文本分析中的SVM引用等等)。
所以应该使用SVM。
我最近看了“Victor Lavrenko”(链接地址为https://www.youtube.com/watch?v=4LINLfsq1yE&list=PLBv09BD7ez_4XyTO5MnDLV9N-s6kgXQy7)关于文本分类的讲座,他比较了被动攻击型分类器和文本分类的线性SVMs。我们将使用假新闻数据集测试这个方法(它有显著的速度优势和永久学习的劣势)。

confusion matrix看起来有些不同,线性模型在真假新闻分类方面做得更好。测试是否可以通过调整alpha值以产生类似的结果。还可以通过网格搜索的参数调优来进行更详尽的搜索。
此时,在所有分类器上执行参数调优,或者看看其他一些“ scikit-learn Bayesian”(链接地址为https://www.atyun.com/wp-admin/post.php?post=5499&action=edit#multinomial-naive-bayes)分类器,可能会很有趣。还可以使用支持向量机(SVM)进行测试,以查看它是否优于被动攻击型分类器。
但我更好奇的是,被动攻击型的模型到底学到了什么。所以我们来看看如何反省。
我们在数据集上的准确率达到了93%。
我对在特性上看到噪音数量的结果持谨慎态度。在StackOverflow上有一个非常有用的函数,可以用来寻找最能影响标签的向量。它只适用于二进制分类器(带有两个类的分类器),但这对你来说是个好消息,因为你只有假或真的标签。
使用带有TF-IDF向量数据集(tfidf_vectorizer)的最好的执行分类器和被动攻击型分类器(linear_clf),检查真假新闻的前30个向量:
也可以用一种非常明显的方式来实现这一点,只需使用几行Python,将系数压缩到特性,并查看列表的顶部和底部。
很明显,可能有一些词汇会显示出政治意图和来源的虚假特征(比如企业和机构)。
真正的新闻数据更频繁的使用动词“说”,可能是因为报纸和大多数新闻出版物的来源是直接引用(“德国总理安吉拉·默克尔说…”)。
从当前的分类器中提取完整的列表,并查看每个标记(或者比较分类器之间的标签)。
另一个用于文本分类的向量化程序是一个HashingVectorizer。虽然hashingvectorizer需要的内存更少并且运行更快(因为它们是稀疏的,并且使用散列而不是标记),但它比反省更难。
可以试着将它的结果和其他向量化程序的结果对比一下。会发现它的性能非常好,比使用MultinomialNB的TF-IDF向量化程序的效果更好,但和使用被动攻击型线性算法的TF-IDF向量化程序不同。


假新闻分类器实验没有完全成功。
但是确实可以用一个新的数据集,测试一些NLP分类模型,然后反省它们。
正如开始所预期的,用简单的词包或TF-IDF向量定义假新闻是一种过于简化的方法。特别是对于包含着各种标记的多语种检索数据集。记住:要一直反省模型。
为了进一步了解这个问题,我推荐Miguel Martinez-Alvarez的文章“如何利用机器学习和AI解决虚假新闻问题”(链接地址为https://miguelmalvarez.com/2017/03/23/how-can-machine-learning-and-ai-help-solving-the-fake-news-problem/)”。
与此同时,我读了米格尔的文章,偶然发现了一个公开的数据科学的帖子用“贝叶斯模型构建一个成功的虚假新闻检测器”(链接地址为https://opendatascience.com/blog/how-to-build-a-fake-news-classification-model/),这个作者甚至创建了带有标记的真假新闻示例数据集的储存库。
在这篇文章中,你将看到我最初的一些探索,也可以看看自己是否可以创建一个成功的虚假新闻检测器。

数据探索
首先,你应该快速浏览数据并且对它的内容有一个大概的了解,使用Pandas数据框架并且检查形状、磁头和应用必要的转换。


提取训练数据
现在的数据框架看起来和需要的很接近,你需要去分离标签并设置训练和培训数据集。
对于该笔记本,我决定使用更长的文章文本,因为我将使用字袋和文档频率(TF-IDF)提取特性,这似乎是一个很好的选择。使用更长的文本有可能为假新闻数据提供明显的词汇和特性。


创建向量化程序分类器
现在已经有了自己的训练和测试数据集,你就可以创建自己的分类器。为了更好地了解文章中的单词和标记是否对新闻的真假有重大影响,首先要使用CountVectorizer和TfidfVectorizer。
这个示例对于使用max_df参数的TF-IDF向量化程序tfidf_vectorizer,将一个最大的阈值设置为.7。这删除了超过70%的文章中出现的单词。此外,内置的stop_words参数将在生成向量之前从数据中删除英语停用词。
有更多的参数可用,你可以在scikit- learn文档中阅读所有关于TfidfVectorizer和CountVectorizer的文档。


现在已经有了向量,你可以研究存储在count_vectorizer和tfidf_vectorizer中的向量特性。
在你所使用的数据集中,有很明显的注释、度量或其他无意义的词以及多语种文章。通常情况下,你需要花更多的时间来处理这个问题和消除噪声,但是本教程只是展示了一个概念的小证明,你将看到模型能否克服这些噪声并正确地分类。


小插曲:计数与TF-IDF特性
我很好奇我的计数和TF-IDF向量化程序是否提取了不同的标记。为了查看和比较特性,你可以将向量信息提取到数据框架以使用简单的Python比较。
通过运行下面的单元格,两个向量化程序都提取了相同的标记,显然这两个标记的权重不同。改变TF-IDF向量化程序的max_df和min_df可能会改变结果,使每个结果具有不同特性。
count_df = pd.DataFrame(count_train.A, columns=count_vectorizer.get_feature_names())
tfidf_df = pd.DataFrame(tfidf_train.A, columns=tfidf_vectorizer.get_feature_names())
difference = set(count_df.columns) - set(tfidf_df.columns)

difference
set()
print(count_df.equals(tfidf_df))
False
count_df.head()
| 00 | 000 | 0000 | 00000031 | 000035 | 00006 | 0001 | 0001pt | 000ft | 000km | ... | حلب | عربي | عن | لم | ما | محاولات | من | هذا | والمرضى | ยงade | |
| 0 | 0 | 0 | 0 | 0 | 0 | 0 | 0 | 0 | 0 | 0 | ... | 0 | 0 | 0 | 0 | 0 | 0 | 0 | 0 | 0 | 0 |
| 1 | 0 | 0 | 0 | 0 | 0 | 0 | 0 | 0 | 0 | 0 | ... | 0 | 0 | 0 | 0 | 0 | 0 | 0 | 0 | 0 | 0 |
| 2 | 0 | 0 | 0 | 0 | 0 | 0 | 0 | 0 | 0 | 0 | ... | 0 | 0 | 0 | 0 | 0 | 0 | 0 | 0 | 0 | 0 |
| 3 | 0 | 0 | 0 | 0 | 0 | 0 | 0 | 0 | 0 | 0 | ... | 0 | 0 | 0 | 0 | 0 | 0 | 0 | 0 | 0 | 0 |
| 4 | 0 | 0 | 0 | 0 | 0 | 0 | 0 | 0 | 0 | 0 | ... | 0 | 0 | 0 | 0 | 0 | 0 | 0 | 0 | 0 | 0 |
5行×56922列
tfidf_df.head()
00 | 000 | 0000 | 00000031 | 000035 | 00006 | 0001 | 0001pt | 000ft | 000km | ... | حلب | عربي | عن | لم | ما | محاولات | من | هذا | والمرضى | ยงade | |
| 0 | 0.0 | 0.0 | 0.0 | 0.0 | 0.0 | 0.0 | 0.0 | 0.0 | 0.0 | 0.0 | ... | 0.0 | 0.0 | 0.0 | 0.0 | 0.0 | 0.0 | 0.0 | 0.0 | 0.0 | 0.0 |
| 1 | 0.0 | 0.0 | 0.0 | 0.0 | 0.0 | 0.0 | 0.0 | 0.0 | 0.0 | 0.0 | ... | 0.0 | 0.0 | 0.0 | 0.0 | 0.0 | 0.0 | 0.0 | 0.0 | 0.0 | 0.0 |
| 2 | 0.0 | 0.0 | 0.0 | 0.0 | 0.0 | 0.0 | 0.0 | 0.0 | 0.0 | 0.0 | ... | 0.0 | 0.0 | 0.0 | 0.0 | 0.0 | 0.0 | 0.0 | 0.0 | 0.0 | 0.0 |
| 3 | 0.0 | 0.0 | 0.0 | 0.0 | 0.0 | 0.0 | 0.0 | 0.0 | 0.0 | 0.0 | ... | 0.0 | 0.0 | 0.0 | 0.0 | 0.0 | 0.0 | 0.0 | 0.0 | 0.0 | 0.0 |
| 4 | 0.0 | 0.0 | 0.0 | 0.0 | 0.0 | 0.0 | 0.0 | 0.0 | 0.0 | 0.0 | ... | 0.0 | 0.0 | 0.0 | 0.0 | 0.0 | 0.0 | 0.0 | 0.0 | 0.0 | 0.0 |
5行×56922列
比较模型
现在是时候训练和测试模型了。
将从NLP最喜欢的MultinomialNB开始。你可以使用它来比较TF-IDF和字袋。CountVectorizer的表现会更好。(有关多项式分布的更多阅读以及为什么最好使用整数,请查看UPenn统计学课程中的简洁说明)。
我个人觉得confusion matrices更容易比较和阅读,所以我使用scikit-learn文档来构建一些易于阅读的confusion matrices(谢谢开源!)。用confusion matrices显示主对角线上的正确标签(左上角到右下角)。其他单元格显示不正确的标签,通常称为假阳性或假阴性。
除了confusion matrices之外,scikit-learn有许多方法来可视化和比较模型。一种比较受欢迎的方式是使用“ROC”(链接地址为http://scikit-learn.org/stable/auto_examples/model_selection/plot_roc_crossval.html)曲线。在 “scikit-learn指标模块”(链接地址为https://www.atyun.com/wp-admin/post.php?post=5499&action=edit#sklearn-metrics-metrics)还有很多其他方法评估模型的可用性。
def plot_confusion_matrix(cm, classes,

                          normalize=False,

                          title='Confusion matrix',

                          cmap=plt.cm.Blues):

    """

    See full source and example:

    http://scikit-learn.org/stable/auto_examples/model_selection/plot_confusion_matrix.html


    This function prints and plots the confusion matrix.

    Normalization can be applied by setting `normalize=True`.

    """

    plt.imshow(cm, interpolation='nearest', cmap=cmap)

    plt.title(title)

    plt.colorbar()

    tick_marks = np.arange(len(classes))

    plt.xticks(tick_marks, classes, rotation=45)

    plt.yticks(tick_marks, classes)


    if normalize:

        cm = cm.astype('float') / cm.sum(axis=1)[:, np.newaxis]

        print("Normalized confusion matrix")

    else:

        print('Confusion matrix, without normalization')


    thresh = cm.max() / 2.

    for i, j in itertools.product(range(cm.shape[0]), range(cm.shape[1])):

        plt.text(j, i, cm[i, j],

                 horizontalalignment="center",

                 color="white" if cm[i, j] > thresh else "black")


    plt.tight_layout()

    plt.ylabel('True label')

    plt.xlabel('Predicted label')
clf = MultinomialNB()
clf.fit(tfidf_train, y_train)

pred = clf.predict(tfidf_test)

score = metrics.accuracy_score(y_test, pred)

print("accuracy:   %0.3f" % score)

cm = metrics.confusion_matrix(y_test, pred, labels=['FAKE', 'REAL'])

plot_confusion_matrix(cm, classes=['FAKE', 'REAL'])
accuracy:   0.857

Confusion matrix, without normalization

clf = MultinomialNB()
clf.fit(count_train, y_train)

pred = clf.predict(count_test)

score = metrics.accuracy_score(y_test, pred)

print("accuracy:   %0.3f" % score)

cm = metrics.confusion_matrix(y_test, pred, labels=['FAKE', 'REAL'])

plot_confusion_matrix(cm, classes=['FAKE', 'REAL'])
accuracy:   0.893

Confusion matrix, without normalization

实际上,没有进行参数调整,计数向量训练集count_train就已经明显优于TF-IDF向量。
测试线性模型
关于线性模型如何与TF-IDF向量化程序协调工作,有很多非常好的报道(查看“word2vec”(链接地址为http://nadbordrozd.github.io/blog/2016/05/20/text-classification-with-word2vec/)的分类,scikit-learn文本分析中的SVM引用等等)。
所以应该使用SVM。
我最近看了“Victor Lavrenko”(链接地址为https://www.youtube.com/watch?v=4LINLfsq1yE&list=PLBv09BD7ez_4XyTO5MnDLV9N-s6kgXQy7)关于文本分类的讲座,他比较了被动攻击型分类器和文本分类的线性SVMs。我们将使用假新闻数据集测试这个方法(它有显著的速度优势和永久学习的劣势)。
linear_clf = PassiveAggressiveClassifier(n_iter=50)
linear_clf.fit(tfidf_train, y_train)

pred = linear_clf.predict(tfidf_test)

score = metrics.accuracy_score(y_test, pred)

print("accuracy:   %0.3f" % score)

cm = metrics.confusion_matrix(y_test, pred, labels=['FAKE', 'REAL'])

plot_confusion_matrix(cm, classes=['FAKE', 'REAL'])
accuracy:   0.936

Confusion matrix, without normalization

confusion matrix看起来有些不同,线性模型在真假新闻分类方面做得更好。测试是否可以通过调整alpha值以产生类似的结果。还可以通过网格搜索的参数调优来进行更详尽的搜索。
clf = MultinomialNB(alpha=0.1)
last_score = 0

for alpha in np.arange(0,1,.1):

    nb_classifier = MultinomialNB(alpha=alpha)

    nb_classifier.fit(tfidf_train, y_train)

    pred = nb_classifier.predict(tfidf_test)

    score = metrics.accuracy_score(y_test, pred)

    if score > last_score:

        clf = nb_classifier

    print("Alpha: {:.2f} Score: {:.5f}".format(alpha, score))
/Users/karlijnwillems/anaconda/envs/ipykernel_py3/lib/python3.6/site-packages/sklearn/naive_bayes.py:699: RuntimeWarning: divide by zero encountered in log

  self.feature_log_prob_ = (np.log(smoothed_fc) -
Alpha: 0.00 Score: 0.61502

Alpha: 0.10 Score: 0.89766

Alpha: 0.20 Score: 0.89383

Alpha: 0.30 Score: 0.89000

Alpha: 0.40 Score: 0.88570

Alpha: 0.50 Score: 0.88427

Alpha: 0.60 Score: 0.87470

Alpha: 0.70 Score: 0.87040

Alpha: 0.80 Score: 0.86609

Alpha: 0.90 Score: 0.85892
此时,在所有分类器上执行参数调优,或者看看其他一些“ scikit-learn Bayesian”(链接地址为https://www.atyun.com/wp-admin/post.php?post=5499&action=edit#multinomial-naive-bayes)分类器,可能会很有趣。还可以使用支持向量机(SVM)进行测试,以查看它是否优于被动攻击型分类器。
但我更好奇的是,被动攻击型的模型到底学到了什么。所以我们来看看如何反省。
反省模型
我们在数据集上的准确率达到了93%。
我对在特性上看到噪音数量的结果持谨慎态度。在StackOverflow上有一个非常有用的函数,可以用来寻找最能影响标签的向量。它只适用于二进制分类器(带有两个类的分类器),但这对你来说是个好消息,因为你只有假或真的标签。
使用带有TF-IDF向量数据集(tfidf_vectorizer)的最好的执行分类器和被动攻击型分类器(linear_clf),检查真假新闻的前30个向量:
See: https://stackoverflow.com/a/26980472


    Identify most important features if given a vectorizer and binary classifier. Set n to the number

    of weighted features you would like to show. (Note: current implementation merely prints and does not

    return top classes.)

    """


    class_labels = classifier.classes_

    feature_names = vectorizer.get_feature_names()

    topn_class1 = sorted(zip(classifier.coef_[0], feature_names))[:n]

    topn_class2 = sorted(zip(classifier.coef_[0], feature_names))[-n:]


    for coef, feat in topn_class1:

        print(class_labels[0], coef, feat)


    print()


    for coef, feat in reversed(topn_class2):

        print(class_labels[1], coef, feat)


most_informative_feature_for_binary_classification(tfidf_vectorizer, linear_clf, n=30)
FAKE -4.86382369883 2016

FAKE -4.13847157932 hillary

FAKE -3.98994974843 october

FAKE -3.10552662226 share

FAKE -2.99713810694 november

FAKE -2.9150746075 article

FAKE -2.54532100449 print

FAKE -2.47115243995 advertisement

FAKE -2.35915304509 source

FAKE -2.31585837413 email

FAKE -2.27985826579 election

FAKE -2.2736680857 oct

FAKE -2.25253568246 war

FAKE -2.19663276969 mosul

FAKE -2.17921304122 podesta

FAKE -1.99361009573 nov

FAKE -1.98662624907 com

FAKE -1.9452527887 establishment

FAKE -1.86869495684 corporate

FAKE -1.84166664376 wikileaks

FAKE -1.7936566878 26

FAKE -1.75686475396 donald

FAKE -1.74951154055 snip

FAKE -1.73298170472 mainstream

FAKE -1.71365596627 uk

FAKE -1.70917804969 ayotte

FAKE -1.70781651904 entire

FAKE -1.68272667818 jewish

FAKE -1.65334397724 youtube

FAKE -1.6241703128 pipeline


REAL 4.78064061698 said

REAL 2.68703967567 tuesday

REAL 2.48309800829 gop

REAL 2.45710670245 islamic

REAL 2.44326123901 says

REAL 2.29424417889 cruz

REAL 2.29144842597 marriage

REAL 2.20500735471 candidates

REAL 2.19136552672 conservative

REAL 2.18030834903 monday

REAL 2.05688105375 attacks

REAL 2.03476457362 rush

REAL 1.9954523319 continue

REAL 1.97002430576 friday

REAL 1.95034103105 convention

REAL 1.94620720989 sen

REAL 1.91185661202 jobs

REAL 1.87501303774 debate

REAL 1.84059602241 presumptive

REAL 1.80111133252 say

REAL 1.80027216061 sunday

REAL 1.79650823765 march

REAL 1.79229792108 paris

REAL 1.74587899553 security

REAL 1.69585506276 conservatives

REAL 1.68860503431 recounts

REAL 1.67424302821 deal

REAL 1.67343398121 campaign

REAL 1.66148582079 fox

REAL 1.61425630518 attack
也可以用一种非常明显的方式来实现这一点,只需使用几行Python,将系数压缩到特性,并查看列表的顶部和底部。
feature_names = tfidf_vectorizer.get_feature_names()
### Most real

sorted(zip(clf.coef_[0], feature_names), reverse=True)[:20]
[(-6.2573612147015822, 'trump'),

 (-6.4944530943126777, 'said'),

 (-6.6539784739838845, 'clinton'),

 (-7.0379446628670728, 'obama'),

 (-7.1465399833812278, 'sanders'),

 (-7.2153760086475112, 'president'),

 (-7.2665628057416169, 'campaign'),

 (-7.2875931446681514, 'republican'),

 (-7.3411184585990643, 'state'),

 (-7.3413571102479054, 'cruz'),

 (-7.3783124419854254, 'party'),

 (-7.4468806724578904, 'new'),

 (-7.4762888011545883, 'people'),

 (-7.547225599514773, 'percent'),

 (-7.5553074094582335, 'bush'),

 (-7.5801506339098932, 'republicans'),

 (-7.5855405012652435, 'house'),

 (-7.6344781725203141, 'voters'),

 (-7.6484824436952987, 'rubio'),

 (-7.6734836186463795, 'states')]
### Most fake

sorted(zip(clf.coef_[0], feature_names))[:20]
[(-11.349866225220305, '0000'),

 (-11.349866225220305, '000035'),

 (-11.349866225220305, '0001'),

 (-11.349866225220305, '0001pt'),

 (-11.349866225220305, '000km'),

 (-11.349866225220305, '0011'),

 (-11.349866225220305, '006s'),

 (-11.349866225220305, '007'),

 (-11.349866225220305, '007s'),

 (-11.349866225220305, '008s'),

 (-11.349866225220305, '0099'),

 (-11.349866225220305, '00am'),

 (-11.349866225220305, '00p'),

 (-11.349866225220305, '00pm'),

 (-11.349866225220305, '014'),

 (-11.349866225220305, '015'),

 (-11.349866225220305, '018'),

 (-11.349866225220305, '01am'),

 (-11.349866225220305, '020'),

 (-11.349866225220305, '023')]
很明显,可能有一些词汇会显示出政治意图和来源的虚假特征(比如企业和机构)。
真正的新闻数据更频繁的使用动词“说”,可能是因为报纸和大多数新闻出版物的来源是直接引用(“德国总理安吉拉·默克尔说…”)。
从当前的分类器中提取完整的列表,并查看每个标记(或者比较分类器之间的标签)。
tokens_with_weights = sorted(list(zip(feature_names, clf.coef_[0])))
小插曲:HashingVectorizer
另一个用于文本分类的向量化程序是一个HashingVectorizer。虽然hashingvectorizer需要的内存更少并且运行更快(因为它们是稀疏的,并且使用散列而不是标记),但它比反省更难。
可以试着将它的结果和其他向量化程序的结果对比一下。会发现它的性能非常好,比使用MultinomialNB的TF-IDF向量化程序的效果更好,但和使用被动攻击型线性算法的TF-IDF向量化程序不同。
hash_vectorizer = HashingVectorizer(stop_words='english', non_negative=True)

hash_train = hash_vectorizer.fit_transform(X_train)

hash_test = hash_vectorizer.transform(X_test)
clf = MultinomialNB(alpha=.01)
clf.fit(hash_train, y_train)

pred = clf.predict(hash_test)

score = metrics.accuracy_score(y_test, pred)

print("accuracy:   %0.3f" % score)

cm = metrics.confusion_matrix(y_test, pred, labels=['FAKE', 'REAL'])

plot_confusion_matrix(cm, classes=['FAKE', 'REAL'])
accuracy:   0.902

Confusion matrix, without normalization

clf = PassiveAggressiveClassifier(n_iter=50)
clf.fit(hash_train, y_train)

pred = clf.predict(hash_test)

score = metrics.accuracy_score(y_test, pred)

print("accuracy:   %0.3f" % score)

cm = metrics.confusion_matrix(y_test, pred, labels=['FAKE', 'REAL'])

plot_confusion_matrix(cm, classes=['FAKE', 'REAL'])
accuracy:   0.921

Confusion matrix, without normalization

结论
假新闻分类器实验没有完全成功。
但是确实可以用一个新的数据集,测试一些NLP分类模型,然后反省它们。
正如开始所预期的,用简单的词包或TF-IDF向量定义假新闻是一种过于简化的方法。特别是对于包含着各种标记的多语种检索数据集。记住:要一直反省模型。

欢迎关注ATYUN官方公众号
商务合作及内容投稿请联系邮箱:bd@atyun.com
热门企业
热门职位
写评论取消
回复取消


