时间序列分析:Python中的ARIMA模型
ARIMA模型是一种流行的时间序列预测工具,可以使用Python中的statsmodels库实现。
时间序列分析广泛用于预报和预测时间序列中的未来点。自回归移动平均(ARIMA)模型被广泛用于时间序列预测,并被认为是最流行的方法之一。在本教程中,我们将学习如何在Python中构建和评估ARIMA模型进行时间序列预测。
什么是ARIMA模型?
ARIMA模型是一种用于分析和预测时间序列数据的统计模型。ARIMA方法明确应对时间序列中的标准结构,为进行有技巧的时间序列预测提供了简单而强大的方法。
ARIMA代表自回归移动平均模型。它结合了三个关键要素:
- 自回归(AR):使用当前观测值和滞后观测值之间的相关性构建模型。滞后观测值的数量称为滞后阶数或p。
- 差分过程(I):使用差分原始观测值使时间序列平稳。差分操作的数量称为d。
- 移动平均(MA):考虑当前观测值与应用于过去观测值的移动平均模型的残差之间的关系。移动平均窗口的大小是阶数或q。
ARIMA模型的定义是使用ARIMA(p,d,q)符号,其中p,d和q被替换为整数值以指定所使用的确切模型。
采用ARIMA模型时的关键假设:
- 时间序列是从基础的ARIMA过程生成的。
- 必须根据原始观测值适当地指定参数p,d,q。
- 在拟合ARIMA模型之前,必须通过差分使时间序列数据变得平稳。
- 如果模型拟合良好,则残差应该是不相关的且正态分布。
总之,ARIMA模型提供了一种有结构且可配置的方法来对时间序列数据进行建模,用于预测等目的。接下来,我们将看一下在Python中拟合ARIMA模型。
Python代码示例
在本教程中,我们将使用Kaggle上的Netflix股票数据来使用ARIMA模型预测Netflix股票价格。
数据加载
我们将加载股票价格数据集,并将“日期”列作为索引。
import pandas as pd


net_df = pd.read_csv("Netflix_stock_history.csv", index_col="Date", parse_dates=True)

net_df.head(3)

数据可视化
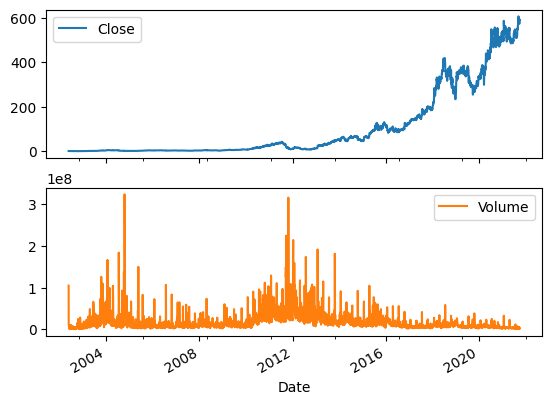
我们可以使用pandas的“plot”函数来可视化随时间变化的股票价格和交易量。很明显,股票价格呈指数增长。
net_df[["Close","Volume"]].plot(subplots=True, layout=(2,1));

滚动预测ARIMA模型
我们的数据集已被分为训练集和测试集,并继续训练ARIMA模型。然后预测了第一个预测。
我们用通用ARIMA模型获得了较差的结果,因为它产生了一条平直的线。因此,我们决定尝试滚动预测方法。
注意:示例代码是BOGDAN IVANYUK的笔记本的修改版本。
from statsmodels.tsa.arima.model import ARIMA

from sklearn.metrics import mean_squared_error, mean_absolute_error

import math


train_data, test_data = net_df[0:int(len(net_df)*0.9)], net_df[int(len(net_df)*0.9):]


train_arima = train_data['Open']

test_arima = test_data['Open']


history = [x for x in train_arima]

y = test_arima

# make first prediction

predictions = list()

model = ARIMA(history, order=(1,1,0))

model_fit = model.fit()

yhat = model_fit.forecast()[0]

predictions.append(yhat)

history.append(y[0])
处理时间序列数据时,由于依赖于先前的观测结果,通常需要进行滚动预测。一种方法是在收到每个新观测结果后重新创建模型。
为了跟踪所有观测结果,我们可以手动维护一个称为历史记录的列表,最初包含训练数据,并在每次迭代中附加新的观测结果。这种方法可以帮助我们得到准确的预测模型。
# rolling forecasts

for i in range(1, len(y)):

    # predict

    model = ARIMA(history, order=(1,1,0))

    model_fit = model.fit()

    yhat = model_fit.forecast()[0]

    # invert transformed prediction

    predictions.append(yhat)

    # observation

    obs = y[i]

    history.append(obs)
模型评估
我们的滚动预测ARIMA模型在简单实现上提高了100%,产生了令人印象深刻的结果。
# report performance

mse = mean_squared_error(y, predictions)

print('MSE: '+str(mse))

mae = mean_absolute_error(y, predictions)

print('MAE: '+str(mae))

rmse = math.sqrt(mean_squared_error(y, predictions))

print('RMSE: '+str(rmse))
MSE: 116.89611817706545

MAE: 7.690948135967959

RMSE: 10.811850821069696
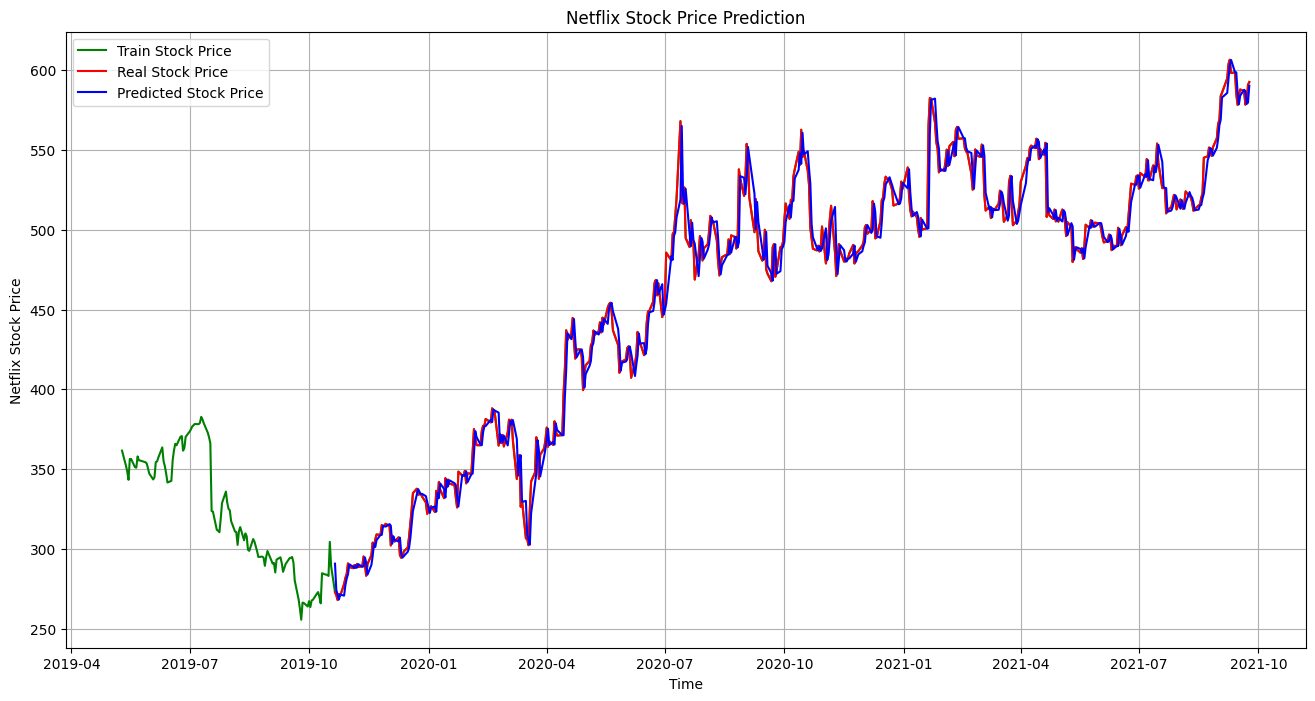
让我们将实际结果与预测结果进行可视化和比较。很明显,我们的模型进行了高度准确的预测。
import matplotlib.pyplot as plt

plt.figure(figsize=(16,8))

plt.plot(net_df.index[-600:], net_df['Open'].tail(600), color='green', label = 'Train Stock Price')

plt.plot(test_data.index, y, color = 'red', label = 'Real Stock Price')

plt.plot(test_data.index, predictions, color = 'blue', label = 'Predicted Stock Price')

plt.title('Netflix Stock Price Prediction')

plt.xlabel('Time')

plt.ylabel('Netflix Stock Price')

plt.legend()

plt.grid(True)

plt.savefig('arima_model.pdf')

plt.show()

结论
在这个简短的教程中,我们概述了ARIMA模型以及如何在Python中实现它们进行时间序列预测。ARIMA 方法提供了一种灵活且结构化的方式来对依赖于先前观测值和过去预测误差的时间序列数据进行建模。


