使用机器学习进行时间序列预测
时间序列预测涉及根据过去的数据点来预测未来的值。可以使用机器学习来进行时间序列预测,通过在历史数据上训练模型来进行预测。
在本文中,我们将在Kaggle平台上的数据集上实施这个应用。这个竞赛是为了探索在一个相对简单和干净的数据集上使用不同的时间序列技术的方法。你将获得5年的商店-物品销售数据,并被要求预测10个不同商店中50个不同物品的销售额的3个月情况。
数据集描述
本次竞赛的目标是预测3个月不同门店的商品销售数据。
文件描述
1. train.csv—训练数据
2. test .csv—测试数据(注意:Public/Private分割是基于时间的)
3. sample_submission.csv—格式正确的示例提交文件
数据字段
1. date -销售数据的日期。没有节日影响或商店关闭。
2. store -商店ID
3. item -项目ID
4. sales -特定日期在特定商店销售的商品数量。
导入库
import time    # To time our operations
import numpy as np  # linear algebra
import pandas as pd     # data processing, CSV file I/O (e.g. pd.read_csv)
from matplotlib import pyplot as plt        # To visualize
import seaborn as sns       # To visualize
import lightgbm as lgb      # To train our model
import warnings     # To ignore some warnings that we don't care
warnings.filterwarnings('ignore')
pd.set_option('display.max_columns', None)  # Unlimited columns
pd.set_option('display.width', 500)     # Width of the display in the notebook
加载数据
train = pd.read_csv('/kaggle/input/demand-forecasting-kernels-only/train.csv', parse_dates=['date'])    # parse_dates: Converts the date column to datetime format.
test = pd.read_csv('/kaggle/input/demand-forecasting-kernels-only/test.csv', parse_dates=['date'])
sample_sub = pd.read_csv('/kaggle/input/demand-forecasting-kernels-only/sample_submission.csv')
我们将训练和测试数据与concat结合起来。
我们将训练数据和测试数据结合起来的原因之一是避免类差异和大小差异。
df = pd.concat([train, test], sort=False)探索性数据分析
def check_df(dataframe, head=5):
    print("##################### Shape #####################")
    print(dataframe.shape)
    print("##################### Types #####################")
    print(dataframe.dtypes)
    print("##################### Head #####################")
    print(dataframe.head(head))
    print("##################### Tail #####################")
    print(dataframe.tail(head))
    print("##################### NA #####################")
    print(dataframe.isnull().sum())
    print("##################### Quantiles #####################")
    print(dataframe.quantile([0, 0.05, 0.50, 0.95, 0.99, 1]).T)
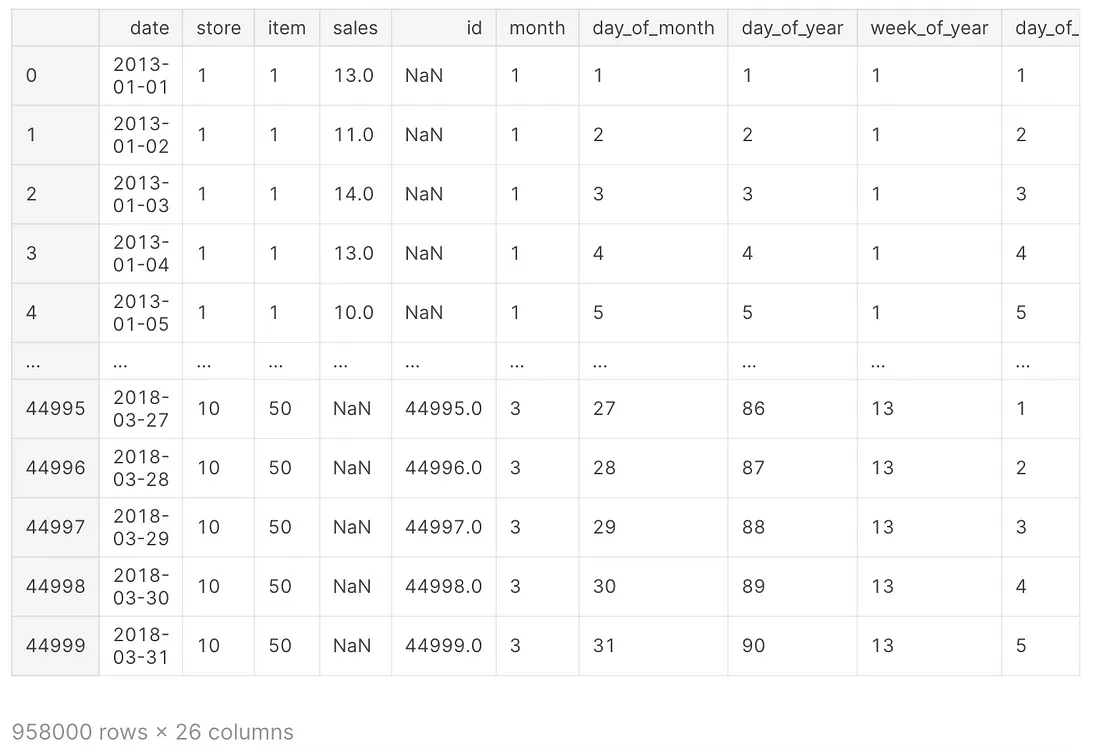
该函数用于在pandas数据框架上执行基本探索性数据分析(EDA)。该函数打印数据帧的形状、列的数据类型、数据帧的第一行和最后几行、每列中缺失值的数量(NA)以及列的分位数。可选的head参数允许您指定在打印数据帧的第一行和最后几行时显示多少行。通过提供这些信息,该函数有助于理解数据的结构、内容和质量。
df["date"].min(), df["date"].max() # First and last dates in the dataset(Timestamp('2013-01-01 00:00:00'), Timestamp('2018-03-31 00:00:00'))check_df(df)##################### Shape #####################
(958000, 5)
##################### Types #####################
date datetime64[ns]
store int64
item int64
sales float64
id float64
dtype: object
##################### Head #####################
date store item sales id
0 2013-01-01 1 1 13.0 NaN
1 2013-01-02 1 1 11.0 NaN
2 2013-01-03 1 1 14.0 NaN
3 2013-01-04 1 1 13.0 NaN
4 2013-01-05 1 1 10.0 NaN
##################### Tail #####################
date store item sales id
44995 2018-03-27 10 50 NaN 44995.0
44996 2018-03-28 10 50 NaN 44996.0
44997 2018-03-29 10 50 NaN 44997.0
44998 2018-03-30 10 50 NaN 44998.0
44999 2018-03-31 10 50 NaN 44999.0
##################### NA #####################
date 0
store 0
item 0
sales 45000
id 913000
dtype: int64
##################### Quantiles #####################
0.00 0.05 0.50 0.95 0.99 1.00
store 1.0 1.00 5.5 10.00 10.00 10.0
item 1.0 3.00 25.5 48.00 50.00 50.0
sales 0.0 16.00 47.0 107.00 135.00 231.0
id 0.0 2249.95 22499.5 42749.05 44549.01 44999.0
df[["store"]].nunique() # Number of storesstore 10
dtype: int64
df[["item"]].nunique() # Number of productsitem 50
dtype: int64
df.groupby(["store"])["item"].nunique() # Number of products in store breakdownstore
1 50
2 50
3 50
4 50
5 50
6 50
7 50
8 50
9 50
10 50
Name: item, dtype: int64
df.groupby(["store", "item"]).agg({"sales": ["sum"]}) # Total sales in store and product breakdown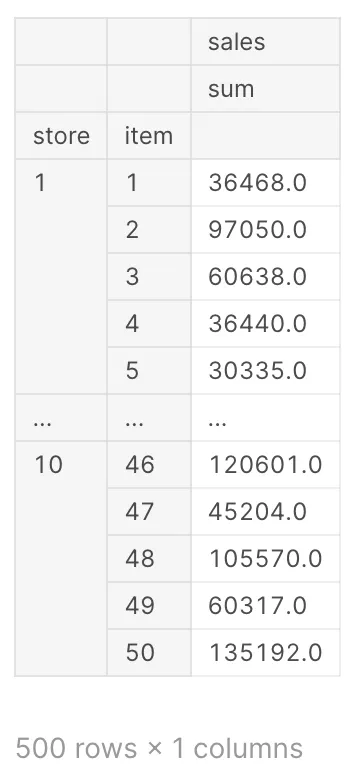
df.groupby(["store", "item"]).agg({"sales": ["sum", "mean", "median", "std"]}) # Total sales, average sales, median sales and standard deviation in store and product breakdown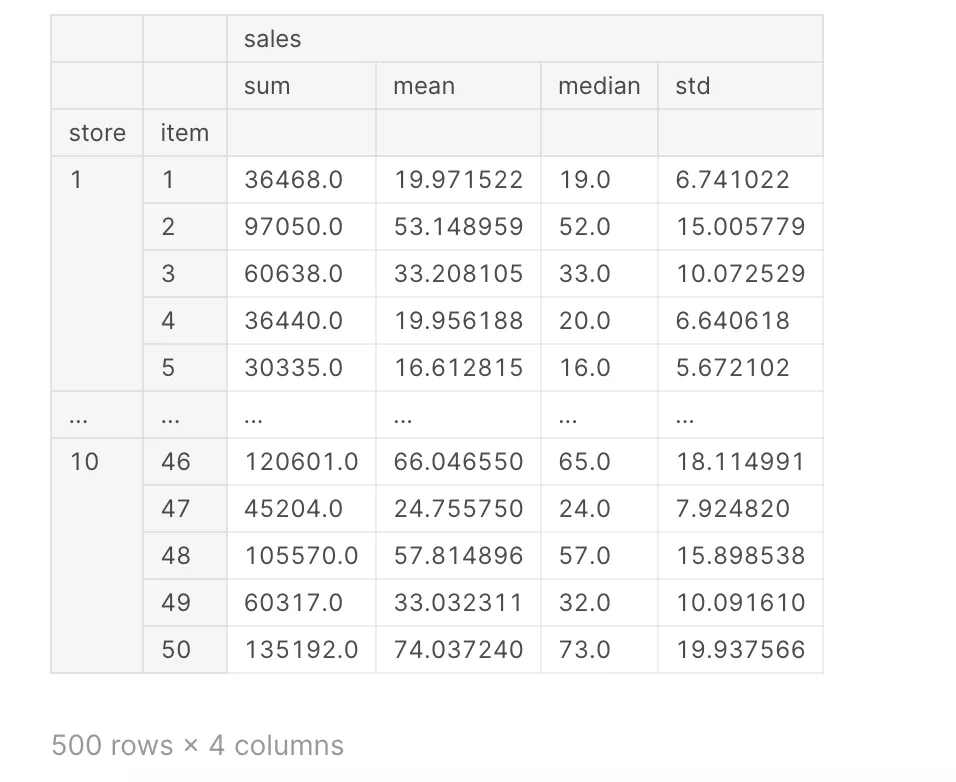
工程特性
def create_date_features(df):
    df['month'] = df.date.dt.month
    df['day_of_month'] = df.date.dt.day
    df['day_of_year'] = df.date.dt.dayofyear
    df['week_of_year'] = df.date.dt.weekofyear
    df['day_of_week'] = df.date.dt.dayofweek
    df['year'] = df.date.dt.year
    df["is_wknd"] = df.date.dt.weekday // 4
    df['is_month_start'] = df.date.dt.is_month_start.astype(int)
    df['is_month_end'] = df.date.dt.is_month_end.astype(int)
    return df
df = create_date_features(df)
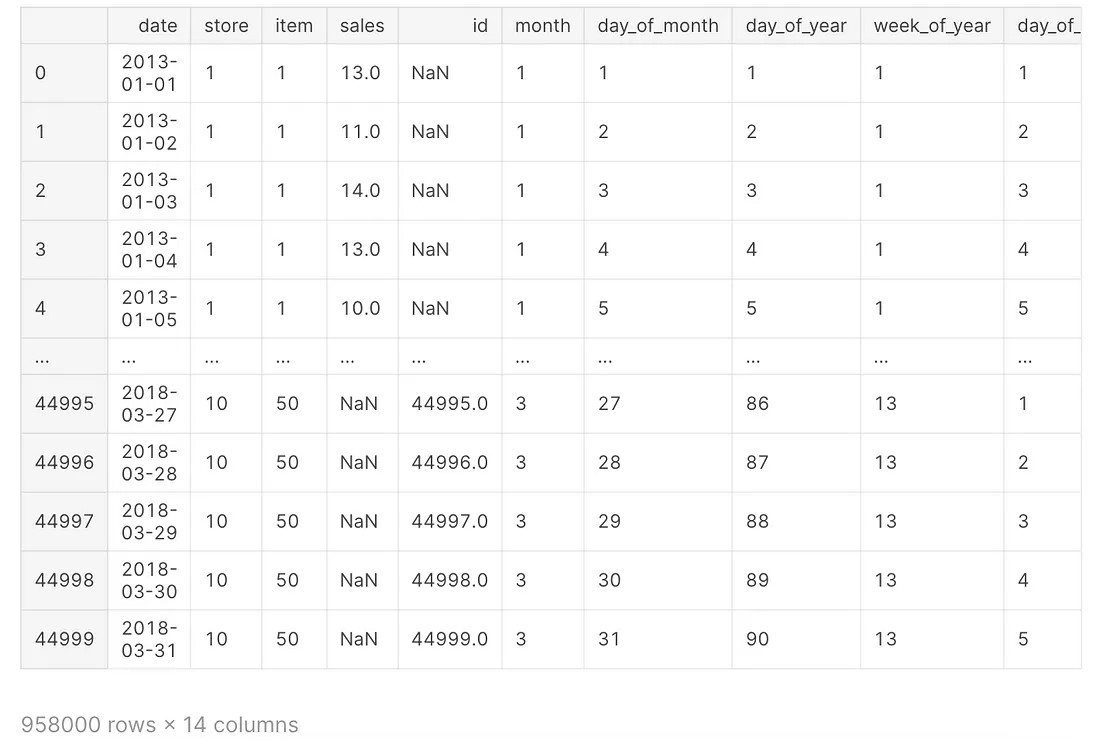
这个函数create_date_features从给定的数据框df的‘date’列创建各种与日期相关的特
征。它返回经过修改的数据框,包含以下附加列:
‘month’:年份的月份(1-12)
1. ‘day_of_month’:月份的日期(1-31)
2. ‘day_of_year’:年份的日期(1-365或闰年的1-366)
3. ‘week_of_year’:年份的周数(1-52)
4. ‘day_of_week’:星期的日期(0-6,星期一为0,星期日为6)
‘year’:年份
1. ‘is_wknd’:一个二进制变量,表示该日是否是周末(0或1)
2. ‘is_month_start’:一个二进制变量,表示该日是否是月份的第一天(0或1)
3. ‘is_month_end’:一个二进制变量,表示该日是否是月份的最后一天(0或1)
df.groupby(["store", "item", "month"]).agg({"sales": ["sum", "mean", "median", "std"]})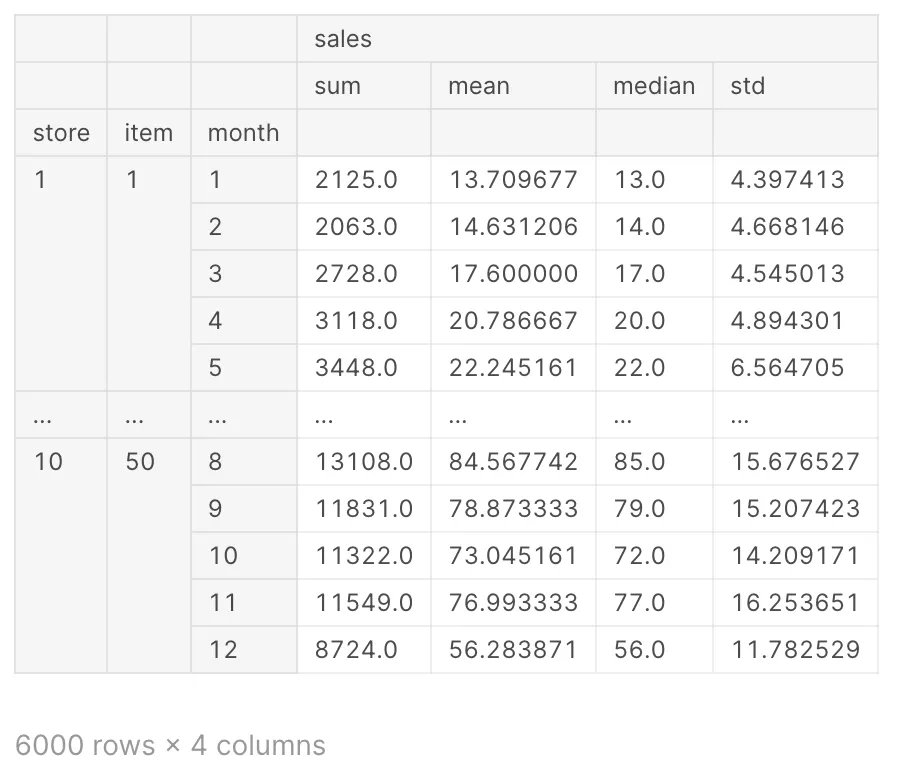
Autoviz
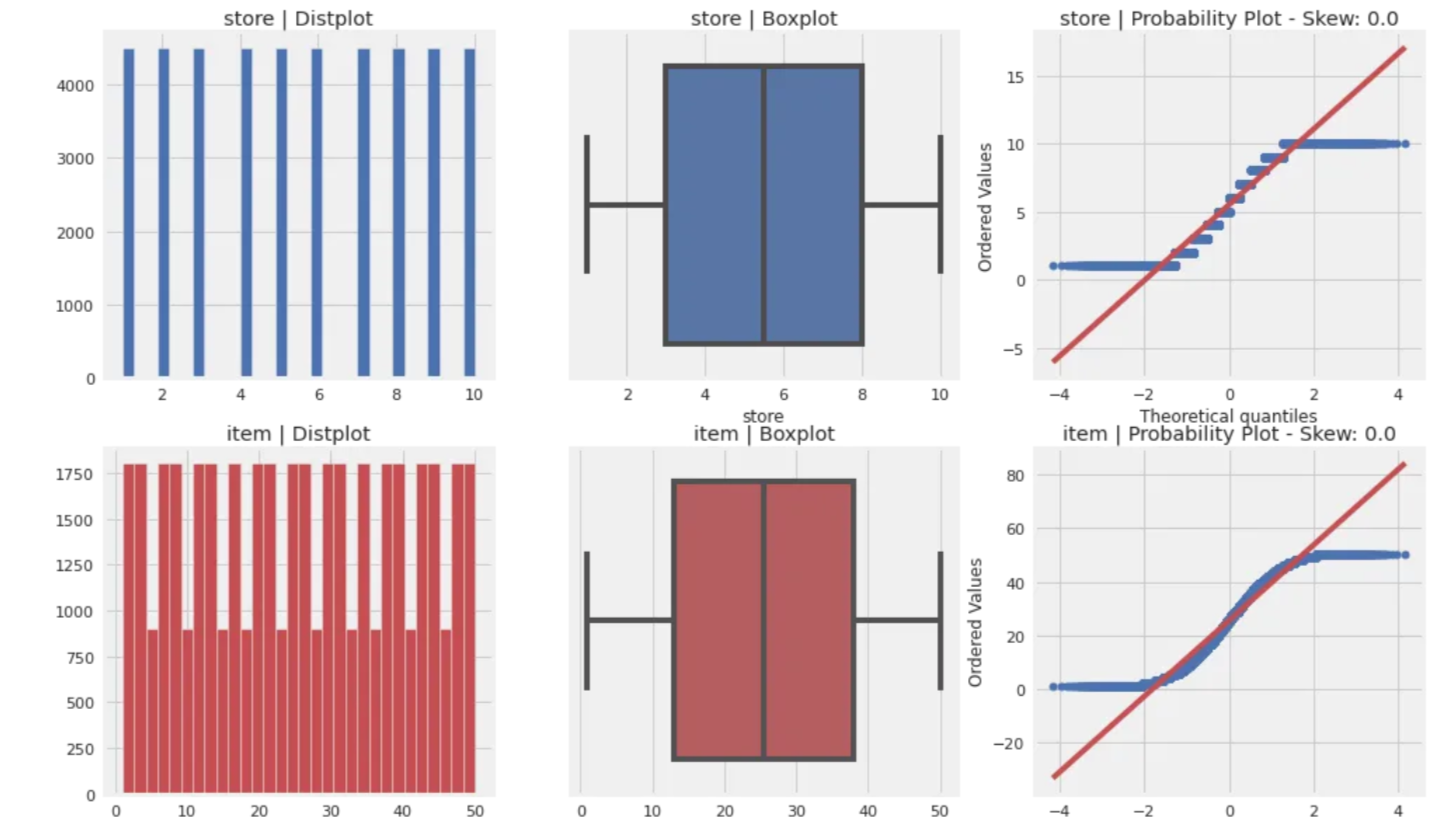
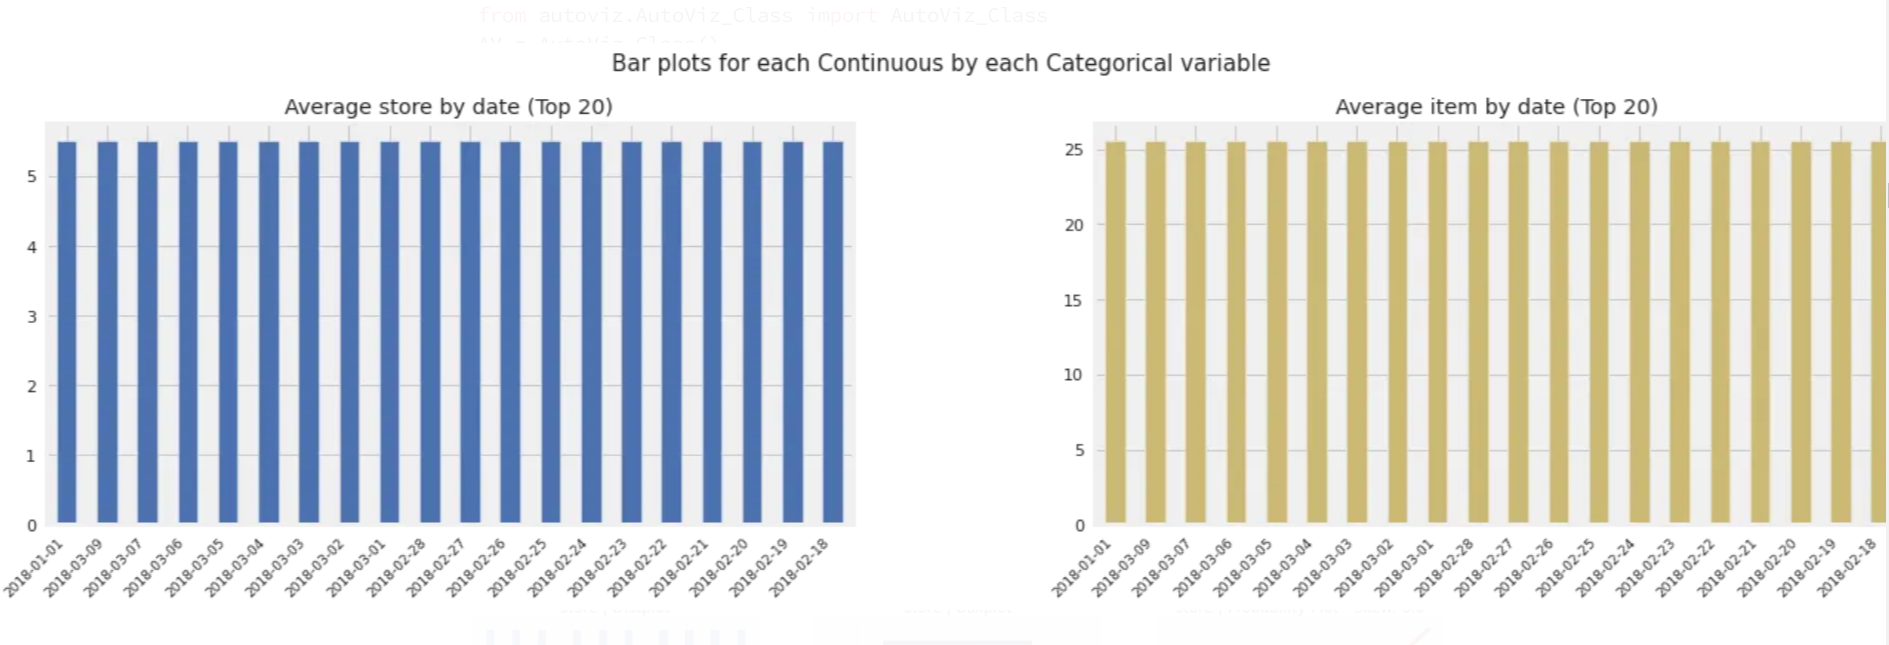
Autoviz的一个关键功能是它能够处理大型和复杂的数据集。它可以快速识别数据中的模式和关系,使其成为数据探索和发现的理想工具。此外,Autoviz具有高度可定制性,允许用户指定他们想要生成的可视化类型,以及图表的颜色方案和布局。
pip install autovizfrom autoviz.AutoViz_Class import AutoViz_Class
AV = AutoViz_Class()
%matplotlib inline
# Generate visualizations
AV.AutoViz("/kaggle/input/demand-forecasting-kernels-only/test.csv")

随机噪声
def random_noise(dataframe):
    return np.random.normal(scale=1.6, size=(len(dataframe),))
滞后或偏移特征
滞后或偏移特征是一种常用的时间序列预测特征工程技术。滞后特征涉及将时间序列数据按指定的时间步数进行偏移,并将偏移后的值用作预测模型的输入特征。
例如,在一个时间序列预测问题中,目标变量可能是某个时间段内某产品的销售额。为了包含过去时间段的信息,我们可以通过将销售数据向后偏移一个或多个时间步长,并使用偏移后的值作为输入特征来创建滞后特征。这为模型提供了关于过去趋势和模式的额外信息,这些信息可能对进行预测有用。
可以为多个滞后期创建滞后特征,比如滞后期1、2、3等。所选择的滞后期数量和滞后期的选择取决于时间序列数据的特性和预测的目标。还可以为其他相关变量创建滞后特征,比如价格、竞争对手数据等。
包含滞后特征可以提高时间序列预测模型的性能,但如果使用不当,也可能导致过度拟合。重要的是要仔细评估滞后特征对模型性能的影响,并使用适当的方法(例如交叉验证)来避免过度拟合。
df.sort_values(by=['store', 'item', 'date'], axis=0, inplace=True)
pd.DataFrame({"sales": df["sales"].values[0:10],    # first 10 values in sales column
              "lag1": df["sales"].shift(1).values[0:10],    # The previous values of the first 10 values in the sales column
              "lag2": df["sales"].shift(2).values[0:10],    # The two previous values of the first 10 values in the sales column
              "lag3": df["sales"].shift(3).values[0:10],    # three previous values of the first 10 values in the sales column
              "lag4": df["sales"].shift(4).values[0:10]})   # four previous values of the first 10 values in the sales column
df.groupby(["store", "item"])['sales'].head()0         13.0
1         11.0
2         14.0
3         13.0
4         10.0
          ...
911174    33.0
911175    37.0
911176    46.0
911177    51.0
911178    41.0
Name: sales, Length: 2500, dtype: float64
0         13.0
1         11.0
2         14.0
3         13.0
4         10.0
          ...
911174    33.0
911175    37.0
911176    46.0
911177    51.0
911178    41.0
Name: sales, Length: 2500, dtype: float64
df.groupby(["store", "item"])['sales'].transform(lambda x: x.shift(1)) # Replaces the values in the sales column with the previous values.0 NaN
1 13.0
2 11.0
3 14.0
4 13.0
...
44995 NaN
44996 NaN
44997 NaN
44998 NaN
44999 NaN
Name: sales, Length: 958000, dtype: float64
def lag_features(dataframe, lags):
    for lag in lags:
        dataframe['sales_lag_' + str(lag)] = dataframe.groupby(["store", "item"])['sales'].transform(
            lambda x: x.shift(lag)) + random_noise(dataframe)
    return dataframe
df = lag_features(df, [91, 98, 105, 112, 119, 126, 182, 364, 546, 728])
check_df(df)
lag_features函数是一个特征工程函数,为给定的时间序列数据框创建滞后特征。该函数接收一个数据框和一个滞后期列表作为输入,对于列表中的每个滞后期,它在数据框中创建一个新的特征,该特征是以指定的时间步数偏移的销售数据。新特征是使用pandas中的shift函数创建的,该函数将销售列中的值按指定的时间步数进行偏移。然后,使用groupby函数将偏移后的值按商店和物品列进行分组,并使用lambda函数对其进行转换,该函数向偏移后的值添加了随机噪声。check_df函数用于检查生成的数据框,以确保滞后特征已正确创建。根据提供的代码,这个函数的确切目的不清楚,但它可能用于检查数据框中的形状、数据类型或值。
滚动平均特征
滚动均值特征是另一种常用的时间序列预测特征工程技术。滚动均值特征涉及在指定的窗口大小上计算时间序列数据的平均值,并将平均值作为预测模型的输入特征。窗口大小可以按照时间步数或时间跨度(如一定数量的天或周)来指定。窗口大小的选择取决于时间序列数据的特性和预测的目标。
包含滚动均值特征可以提高时间序列预测模型的性能,但重要的是要使用适当的方法来避免过度拟合。还需要仔细评估滚动均值特征对模型性能的影响,并考虑其他特征工程技术(如滞后特征)的选择。
pd.DataFrame({"sales": df["sales"].values[0:10],
              "roll2": df["sales"].rolling(window=2).mean().values[0:10],
              "roll3": df["sales"].rolling(window=3).mean().values[0:10],
              "roll5": df["sales"].rolling(window=5).mean().values[0:10]})
pd.DataFrame({"sales": df["sales"].values[0:10],
              "roll2": df["sales"].shift(1).rolling(window=2).mean().values[0:10],
              "roll3": df["sales"].shift(1).rolling(window=3).mean().values[0:10],
              "roll5": df["sales"].shift(1).rolling(window=5).mean().values[0:10]})

def roll_mean_features(dataframe, windows):
    for window in windows:
        dataframe['sales_roll_mean_' + str(window)] = dataframe.groupby(["store", "item"])['sales']. \
                                                          transform(
            lambda x: x.shift(1).rolling(window=window, min_periods=10, win_type="triang").mean()) + random_noise(
            dataframe)
    return dataframe

df = roll_mean_features(df, [365, 546])
指数加权平均特征
指数加权均值特征与滚动均值特征类似,但是不同于使用固定窗口大小计算均值,指数加权均值特征使用指数衰减的加权方案,对最近的观测值给予更高的重要性,对较旧的观测值给予较低的重要性。
权重方案中的衰减因子可以指定,以控制对最近观测值的重要性。较小的衰减因子将赋予最近观测值更高的重要性,而较大的衰减因子将赋予较旧的观测值更高的重要性。衰减因子的选择取决于时间序列数据的特性和预测的目标。
包含指数加权均值特征可以提高时间序列预测模型的性能,但重要的是要使用适当的方法来避免过度拟合。还需要仔细评估指数加权均值特征对模型性能的影响,并考虑其他特征工程技术(如滞后特征或滚动均值特征)的选择。
pd.DataFrame({"sales": df["sales"].values[0:10],
              "roll2": df["sales"].shift(1).rolling(window=2).mean().values[0:10],
              "ewm099": df["sales"].shift(1).ewm(alpha=0.99).mean().values[0:10],
              "ewm095": df["sales"].shift(1).ewm(alpha=0.95).mean().values[0:10],
              "ewm07": df["sales"].shift(1).ewm(alpha=0.7).mean().values[0:10],
              "ewm02": df["sales"].shift(1).ewm(alpha=0.1).mean().values[0:10]})
def ewm_features(dataframe, alphas, lags):
    for alpha in alphas:
        for lag in lags:
            dataframe['sales_ewm_alpha_' + str(alpha).replace(".", "") + "_lag_" + str(lag)] = \
                dataframe.groupby(["store", "item"])['sales'].transform(lambda x: x.shift(lag).ewm(alpha=alpha).mean())
    return dataframe
alphas = [0.95, 0.9, 0.8, 0.7, 0.5]
lags = [91, 98, 105, 112, 180, 270, 365, 546, 728]
df = ewm_features(df, alphas, lags)
check_df(df)
一次性编码
该代码使用了pandas库中的pd.get_dummies函数,对数据框df中的几列进行one-hot 编码。one-hot 编码是机器学习中常见的预处理步骤,用于将分类变量转换为可以作为模型输入特征的数值表示。
pd.get_dummies函数的columns参数用于指定哪些列应该被进行one-hot 编码。在这个例子中,选中了store、item、day_of_week和month列进行one-hot 编码。
one-hot编码为指定列中的每个唯一类别创建一个新的二进制列。例如,如果store列有三个唯一类别,则会创建三个新列,每个类别一个,其中的值为1或0,表示数据中是否存在该类别。
one-hot编码的目的是允许将分类变量用作机器学习模型的输入特征,而这些模型通常需要数值类型的输入。通过对分类变量进行独热编码,将类别中包含的信息转化为数值表示,以便模型使用。
check_df函数用于检查生成的数据框,以确保one-hot编码已正确应用。根据提供的代码,这个函数的确切目的不清楚,但它可能用于检查数据框中的形状、数据类型或值。
df = pd.get_dummies(df, columns=['store', 'item', 'day_of_week', 'month'])
check_df(df)
将销售额转换为日志(1+销售额)
df['sales'] = np.log1p(df["sales"].values)
check_df(df)
上述代码对数据框df中的销售数据进行对数转换。对数转换使用了NumPy库中的np.log1p函数,该函数计算输入数组x的log(1 + x)。
对数转换是时间序列数据的常见预处理步骤,它可以帮助稳定数据的方差,并使其更适合建模。通过将销售数据转换为对数空间,可以减少销售数据中大幅波动的影响,并使特征与目标变量之间的关系更加清晰。
模型
# MAE: mean absolute error
# MAPE: mean absolute percentage error
# SMAPE: Symmetric mean absolute percentage error (adjusted MAPE)

def smape(preds, target):
    n = len(preds)
    masked_arr = ~((preds == 0) & (target == 0))
    preds, target = preds[masked_arr], target[masked_arr]
    num = np.abs(preds - target)
    denom = np.abs(preds) + np.abs(target)
    smape_val = (200 * np.sum(num / denom)) / n
    return smape_val
def lgbm_smape(preds, train_data):
    labels = train_data.get_label()
    smape_val = smape(np.expm1(preds), np.expm1(labels))
    return 'SMAPE', smape_val, False
上述代码定义了一种用于评估机器学习模型性能的自定义指标,称为对称平均绝对百分比误差(SMAPE)。SMAPE指标用于衡量预测值与实际目标值之间的百分比误差。
smape函数接受两个数组作为输入,分别代表预测值preds和实际目标值target。函数首先检查预测值和目标值均为零的情况,并将这些情况屏蔽,使其不参与后续的计算。
接下来,计算预测值和目标值的绝对差,并将其除以预测值和目标值的绝对值之和。SMAPE值通过对所有数据点的这些比率求平均来计算。SMAPE值以百分比表示,值为0表示完美预测,大于0的值表示有误差。
SMAPE指标是一种对称指标,意味着对超出预测和低于预测的情况均等对待。这使得它可以用于评估模型在可能同时存在正值和负值的数据上的性能,以及对于具有偏斜分布的数据,其中一种类型的预测误差比另一种类型的更常见。
基于时间的验证集
train
test
# Train set until the beginning of 2017 (until the end of 2016).
train = df.loc[(df["date"] < "2017-01-01"), :]
# First 3 months of 2017 validation set.
val = df.loc[(df["date"] >= "2017-01-01") & (df["date"] < "2017-04-01"), :]
cols = [col for col in train.columns if col not in ['date', 'id', "sales", "year"]]
Y_train = train['sales']
X_train = train[cols]
Y_val = val['sales']
X_val = val[cols]
Y_train.shape, X_train.shape, Y_val.shape, X_val.shape
((730500,), (730500, 142), (45000,), (45000, 142))基于LightGBM的时间序列模型
# LightGBM parameters
lgb_params = {'num_leaves': 10,
              'learning_rate': 0.02,
              'feature_fraction': 0.8,
              'max_depth': 5,
              'verbose': 0,
              'num_boost_round': 1000,
              'early_stopping_rounds': 200,
              'nthread': -1}
# metric mae: l1, absolute loss, mean_absolute_error, regression_l1
# mse: l2, square loss, mean_squared_error, mse, regression_l2, regression
# rmse, root square loss, root_mean_squared_error, l2_root
# mape, MAPE loss, mean_absolute_percentage_error
lgbtrain = lgb.Dataset(data=X_train, label=Y_train, feature_name=cols)
lgbval = lgb.Dataset(data=X_val, label=Y_val, reference=lgbtrain, feature_name=cols)
model = lgb.train(lgb_params, lgbtrain,
                  valid_sets=[lgbtrain, lgbval],
                  num_boost_round=lgb_params['num_boost_round'],
                  early_stopping_rounds=lgb_params['early_stopping_rounds'],
                  feval=lgbm_smape,
                  verbose_eval=100)
[LightGBM] [Warning] Auto-choosing col-wise multi-threading, the overhead of testing was 0.371499 seconds.
You can set `force_col_wise=true` to remove the overhead.
Training until validation scores don't improve for 200 rounds
[100] training's l2: 0.0512913 training's SMAPE: 17.5863 valid_1's l2: 0.0529452 valid_1's SMAPE: 17.4429
[200] training's l2: 0.0352035 training's SMAPE: 14.5662 valid_1's l2: 0.0369583 valid_1's SMAPE: 14.8761
[300] training's l2: 0.0324151 training's SMAPE: 14.0096 valid_1's l2: 0.0341202 valid_1's SMAPE: 14.4213
[400] training's l2: 0.0313431 training's SMAPE: 13.7968 valid_1's l2: 0.0332429 valid_1's SMAPE: 14.2604
[500] training's l2: 0.0306813 training's SMAPE: 13.6622 valid_1's l2: 0.0326193 valid_1's SMAPE: 14.1237
[600] training's l2: 0.0302368 training's SMAPE: 13.5684 valid_1's l2: 0.032161 valid_1's SMAPE: 14.0164
[700] training's l2: 0.0298809 training's SMAPE: 13.4971 valid_1's l2: 0.031855 valid_1's SMAPE: 13.9461
[800] training's l2: 0.0295966 training's SMAPE: 13.4403 valid_1's l2: 0.0316245 valid_1's SMAPE: 13.8914
[900] training's l2: 0.0293529 training's SMAPE: 13.3908 valid_1's l2: 0.0314269 valid_1's SMAPE: 13.8454
[1000] training's l2: 0.0291449 training's SMAPE: 13.3487 valid_1's l2: 0.031298 valid_1's SMAPE: 13.8149
Did not meet early stopping. Best iteration is:
[1000] training's l2: 0.0291449 training's SMAPE: 13.3487 valid_1's l2: 0.031298 valid_1's SMAPE: 13.8149
y_pred_val = model.predict(X_val, num_iteration=model.best_iteration)
smape(np.expm1(y_pred_val), np.expm1(Y_val))
13.814874270278832特性重要性等级
def plot_lgb_importances(model, plot=False, num=10):
    gain = model.feature_importance('gain')
    feat_imp = pd.DataFrame({'feature': model.feature_name(),
                             'split': model.feature_importance('split'),
                             'gain': 100 * gain / gain.sum()}).sort_values('gain', ascending=False)
    if plot:
        plt.figure(figsize=(10, 10))
        sns.set(font_scale=1)
        sns.barplot(x="gain", y="feature", data=feat_imp[0:25])
        plt.title('feature')
        plt.tight_layout()
        plt.show()
    else:
        print(feat_imp.head(num))
    return feat_imp
plot_lgb_importances(model, num=200)
                feature          split       gain
17          sales_roll_mean_546    936  54.465207
13                sales_lag_364   1271  13.219649
16          sales_roll_mean_365    606   9.754873
60   sales_ewm_alpha_05_lag_365    384   4.890732
18   sales_ewm_alpha_095_lag_91     81   2.518718
..                          ...    ...        ...
66                      store_4      0   0.000000
83                      item_11      0   0.000000
111                     item_39      0   0.000000
74                       item_2      0   0.000000
71                      store_9      0   0.000000
[142 rows x 3 columns]
plot_lgb_importances(model, num=30, plot=True)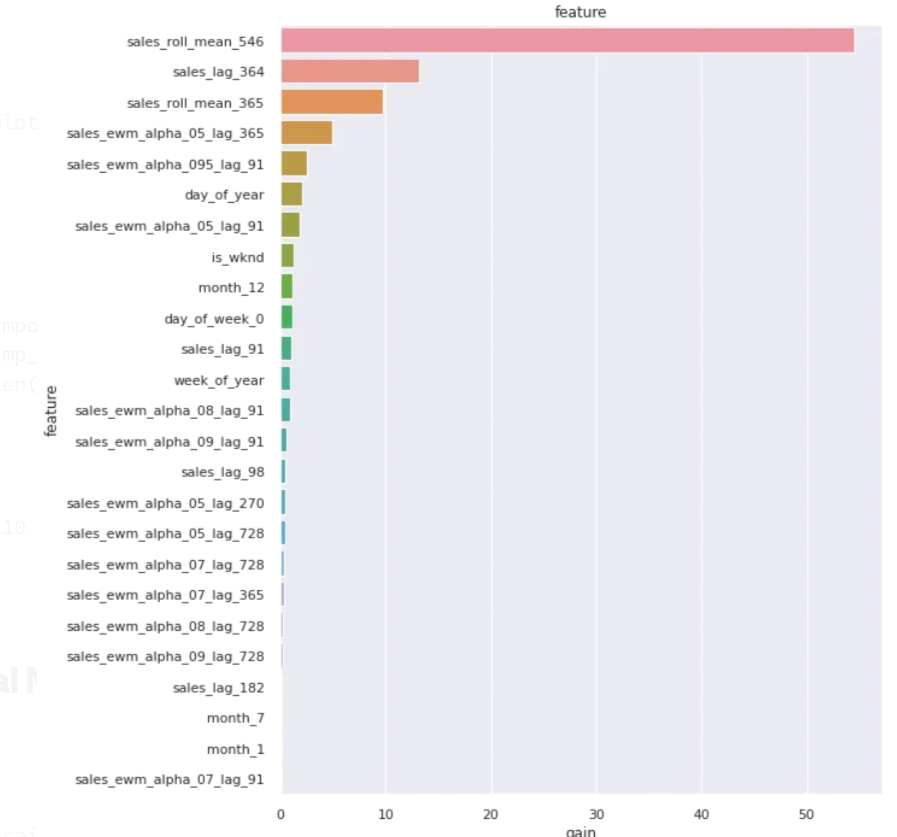
importance_zero = feat_imp[feat_imp["gain"] == 0]["feature"].values
imp_feats = [col for col in cols if col not in importance_zero]
len(imp_feats)
110最终的模型
train = df.loc[~df.sales.isna()]
Y_train = train['sales']
X_train = train[cols]

test = df.loc[df.sales.isna()]
X_test = test[cols]
lgb_params = {'num_leaves': 10,
              'learning_rate': 0.02,
              'feature_fraction': 0.8,
              'max_depth': 5,
              'verbose': 0,
              'nthread': -1,
              "num_boost_round": model.best_iteration}
lgbtrain_all = lgb.Dataset(data=X_train, label=Y_train, feature_name=cols)
final_model = lgb.train(lgb_params, lgbtrain_all, num_boost_round=model.best_iteration)

test_preds = final_model.predict(X_test, num_iteration=model.best_iteration)
提交文件
提交的作品将在预测值和实际值之间进行SMAPE评估。当实际值和预测值都为0时,我们定义SMAPE = 0。
submission_df = test.loc[:, ["id", "sales"]]
submission_df['sales'] = np.expm1(test_preds)
submission_df['id'] = submission_df.id.astype(int)
submission_df.to_csv("submission.csv", index=False)


