使用Temporal Fusion Transformer预测图书销量
在这部分中,我们将使用Kaggle的Tabular playground系列(2022年9月)数据集,对TFT进行训练和测试。我们将使用开源的Python包Pytorch Forecasting来实现模型。你可以使用pip安装它:
$ pip install pytorch-forecastingPytorch Forecasting基于Pytorch Lightning,并整合了Optuna用于超参数调优。
数据探索
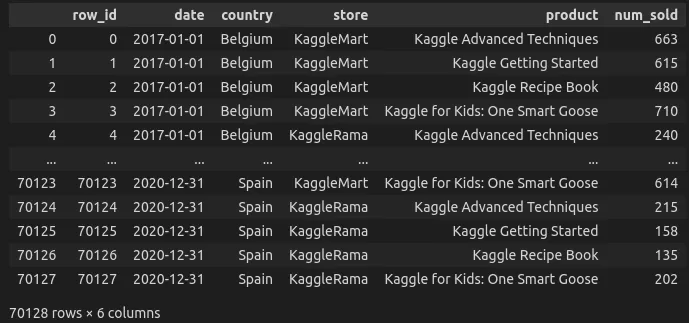
Tabular playground series数据集包含来自六个不同国家两家商店的4种书籍的每日销售总量。我们有从2017年到2020年的超过4年的训练数据。目标是预测2021年每本书在每个商店和每个国家的销售数量。
我们将在2017年至2019年之间训练我们的模型,将2020年用作验证。正如你可能猜到的那样,在这种情况下的一个主要挑战是如何处理COVID-19大流行对2020年数据的影响。
让我们先来看一下数据:
DATAPATH = Path("./tabular-playground-series-sep-2022/")
train_df = pd.read_csv(DATAPATH / "train.csv")
train_df['date']  = pd.to_datetime(train_df['date'])
test_df = pd.read_csv(DATAPATH / "test.csv")
test_df['date']  = pd.to_datetime(test_df['date'])
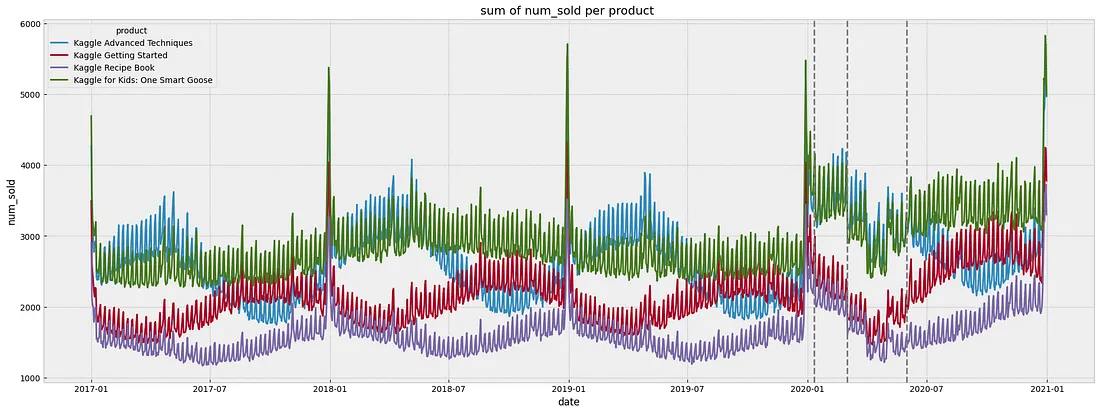
fig, ax = plt.subplots(1, 1, figsize = (23, 8))
sns.lineplot(x='date', y='num_sold', hue='product', data=(train_df.groupby(['date', 'product']).num_sold.sum().to_frame()))
ax.set_title("sum of num_sold per product ")
同样的,
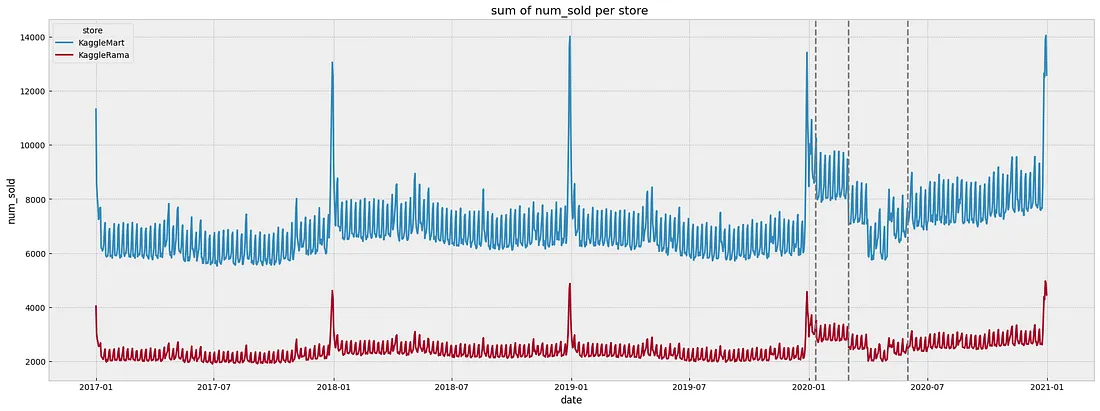
每店每日总销售额
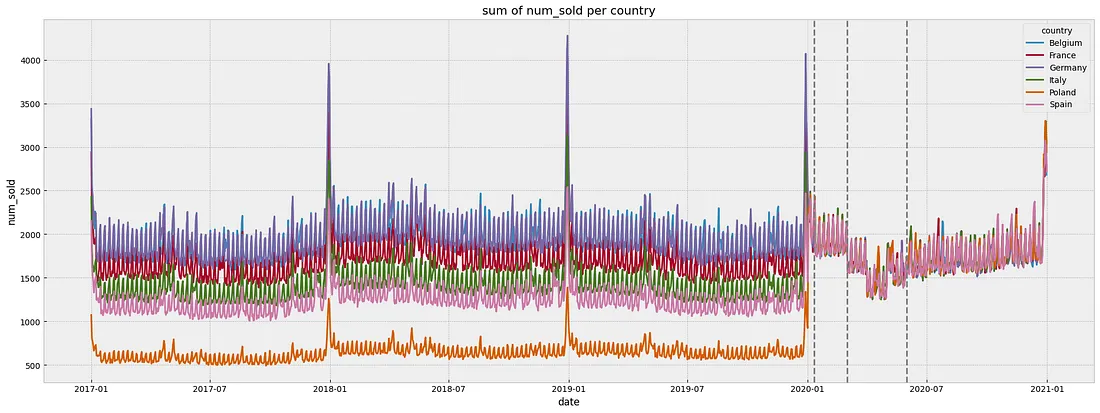
每个国家/地区的每日总销售额
我们拥有的数据:
1. 该数据集不包含缺失值或缺失时间步长,
2. 与之前的年份相比,2020年的数据模式发生了显著变化。销售额在3月~5月份的下降主要是由于欧洲COVID-19封锁和限制措施造成的,
3. 与2017年~2019年相比,2020年的平均销售额显著增加。同样地,我们注意到与同年下半年相比,2020年11月1日~2月29日期间的平均销售额有所增加,
4. 总体上,数据似乎包含了每周和每年的季节性变化,并且周末销售额增加。我们还注意到在年末假期期间销售额出现峰值。
我们首先通过使2017年~2019年的数据与2020年的数据保持相同水平,来解决每个国家年均销售额的变动。这将通过在相似的数据上进行训练和测试来提高我们模型的泛化性能。
# Add a year column
train_df_processed["year"]=train_df_processed.index.year
# Get average sales for each country in each year
mean_country_year = train_df_processed[['country', 'year', "num_sold"]].groupby(['country', 'year'], as_index=False).mean()
# Shift the mean of 2017~2019 sales data w.r.t. 2020
for country in train_df_processed.country.unique():
    mean_2020 = mean_country_year.loc[(mean_country_year['year'] == 2020) & (mean_country_year['country'] == country), 'num_sold'].values[0]
    for year in train_df_processed.year.unique():
        if year==2020:
            break
        mean_year = mean_country_year.loc[(mean_country_year['year'] == year) & (mean_country_year['country'] == country), 'num_sold'].values[0]
        factor = mean_2020/mean_year
        train_df_processed.loc[(train_df_processed["country"]==country) & (train_df_processed["year"]==year),"num_sold"]= train_df_processed.loc[(train_df_processed["country"]==country) & (train_df_processed["year"]==year),"num_sold"]*factor
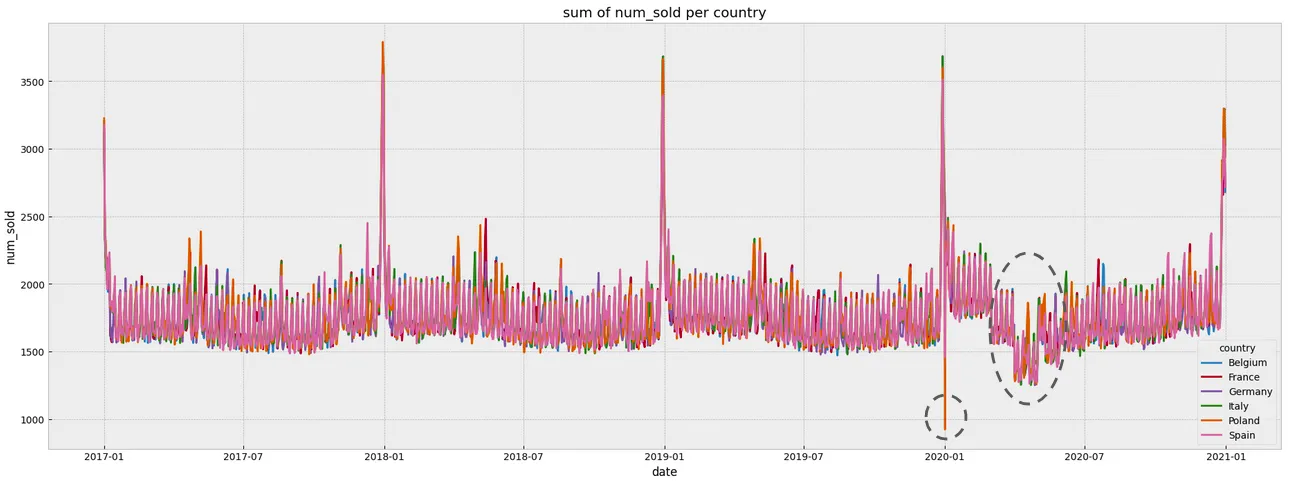
2020年3月~5月的封锁期间并不反映我们希望模型学习的一般模式,因为它们不能推广到后续年份。包含这些月份的数据将对性能产生负面影响。
针对处理疫情对时间序列建模数据的影响,可以考虑不同的策略。最直接的解决方案是在建模过程中简单地排除这段有问题的时间段,因为它代表了一个异常值。这种方法可能有效,因为在疫情恢复之后,数据模式与之前相似。
然而,考虑到我们拥有的历史数据量有限,以及我们将使用受疫情影响的2020年数据进行验证(即模型将在疫情前进行训练和疫情后进行测试),我们更愿意尝试通过我们对“如果没有疫情会发生什么”的估计来删除/替换这些数据。这导致在2021年的盲测中取得了最佳结果。
我们还将丢弃和替换2020年1月1日的异常值。
作为填充策略,我们从2017年开始,采用前几年的平均销售额。确保在替换3月~5月数据时尊重每周和每年的季节性:
# handle 01-01-2020 outlier
train_df_processed.loc[pd.Timestamp('2020-01-01'), "num_sold"]=np.nan
df_shifted = pd.concat(
        [train_df_processed[["num_sold"]].shift(periods=365*48*x) for x in range(3)], axis=1
    )
train_df_processed[["num_sold"]] = train_df_processed[["num_sold"]].fillna(df_shifted.groupby(by=df_shifted.columns, axis=1).mean())
# handle March~May lockdown outliers
train_df_processed.loc[(train_df_processed.year==2020)&(train_df_processed.index.month.isin([3,4,5])), "num_sold"]=np.nan
df_shifted = pd.concat(
        [train_df_processed[["num_sold"]].shift(periods=52*7*48*x) for x in range(3)], axis=1
    )
train_df_processed[["num_sold"]] = train_df_processed[["num_sold"]].fillna(df_shifted.groupby(by=df_shifted.columns, axis=1).mean())
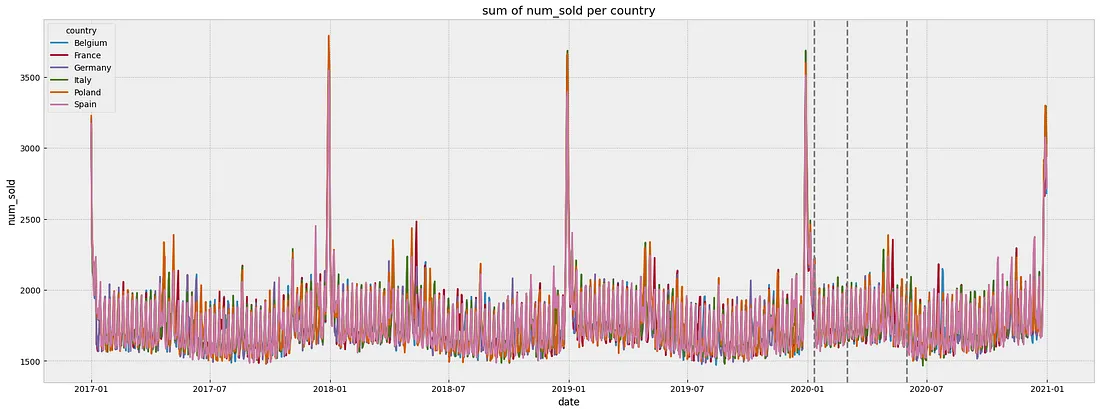
为了考虑数据显示的每周和每年的季节性,我们添加了以下日历特征:周末旗、工作日和一年中的星期。对于工作日和周的特征,我们使用循环编码来反映它们的周期性。
CALENDAR_CYCLES = {
    "weekday": 7,
    "week": 52,
    "month": 12,
}
def add_cyclical_calendar_features(df: pd.DataFrame, features: Union[str, List[str]]):
    """Cyclical encoding of calendar features"""
    if isinstance(features, str):multi-head attention
        features = [features]
    for feat in features:
        assert (
            feat in CALENDAR_CYCLES.keys()
        ), f"Cyclical encoding is not available for {feat}"

        values = getattr(df.index, feat)
        df[f"{feat}_sin"] = np.sin(2 * np.pi * values / CALENDAR_CYCLES[feat])
        df[f"{feat}_cos"] = np.cos(2 * np.pi * values / CALENDAR_CYCLES[feat])
    return df
# add calendar features
train_df_processed = add_cyclical_calendar_features(train_df_processed.set_index("date"), features=["weekday", "week"])
train_df_processed["weekend"] = (train_df_processed.index.dayofweek > 4).astype(int)
我们还为国家的法定假日(我们使用假日包)和年终假期(从12月24日到31日)添加了布尔标志。
# add holidays flag
holidays_dates_per_country = {}
for country in train_df_processed["country"].unique():
    holidays_dates_per_country[country]=[tuple[0] for tuple in list(getattr(holidays, country)(years=set(train_df_processed.index.year)).items())]
    train_df_processed.loc[train_df_processed["country"]==country, "holidays"]=train_df_processed.loc[train_df_processed["country"]==country].index.isin(holidays_dates_per_country[country])
train_df_processed["holidays"] = train_df_processed["holidays"].astype(int)
# add end-of-year holidays flag
train_df_processed["newyear"]=0
for day in range(25,32):
    train_df_processed.loc[(train_df_processed.index.month == 12) & (train_df_processed.index.day == day),"newyear"]=1
模型训练
Pytorch Forecasting库要求使用TimeSeriesDataSet对象来封装数据,特征名称(目标变量、静态协变量、随时间变化的已知和未知变量、滞后值)、特征编码器、缩放器、回溯窗口的最大和最小长度,以及序列到序列块的预测时间范围等。
提醒一下,在TFT中,静态协变量是关于所测实体(例如书籍)的静态元数据,它们不随时间变化(例如国家、商店、产品)而变化。静态协变量用于定义组,以区分数据集中包含的各个时间序列。组的数量等于所有可能的静态协变量值组合的数量。
在我们的用例中,我们将有48个独立的时间序列:国家数量*商店数量*产品数量。
TimeSeriesDataSet期望提供的数据包含一个整数列,用于表示时间索引。如果没有缺失的时间步长,时间索引应该从0开始,并按每个独立时间序列加1递增。
我们将日期列替换为time_idx:
train = train_df_processed.reset_index()
train = (train.merge((train[['date']].drop_duplicates(ignore_index=True).rename_axis('time_idx')).reset_index(), on = ['date'])).drop(["date", "row_id"], axis=1)
我们使用这个时间索引从每个单独的时间序列中删除最后的max_prediction_length时间步长,也就是说,确保验证集与训练集完全分离。
max_prediction_length = 365 # a whole year
min_encoder_length = 365
max_encoder_length = train.index.nunique()
# keep the validation set held-out
training_cutoff = train["time_idx"].max() - max_prediction_length # validation on 2020
考虑到我们的时间序列数据在不同组(国家、商店和产品)之间的量级不同,我们使用GroupNormalizer分别对每个时间序列进行规范化。
为了解释销售数据中的自相关性,我们明确地添加了t-7(前一周的同一天)和t-365(前一年)的滞后特征。
# Create training set
training_dataset = TimeSeriesDataSet(
    train[lambda x: x.time_idx <= training_cutoff],
    time_idx="time_idx",
    target="num_sold", # target variable
    group_ids=["country", "store", "product"], # static covariates
    max_encoder_length=max_encoder_length, # maximum size of lookup window
    min_encoder_length=max_encoder_length//2,
    max_prediction_length=max_prediction_length, # maximum size of horizon window
    min_prediction_length=max_prediction_length,
    time_varying_known_reals=[
        "time_idx", 'weekday_cos', 'weekday_sin', 'week_cos', 'week_sin', 'weekend', 'holidays', 'newyear'],
    time_varying_unknown_categoricals=[],
    time_varying_unknown_reals=['num_sold'],
    target_normalizer=GroupNormalizer(finalement
        groups=["country", "store", "product"], transformation="softplus"
    ),  # use softplus transformation and normalize by group
    lags={'num_sold': [7,365]}, # add lagged values of target variable
    add_relative_time_idx=True,
    add_target_scales=True,
    add_encoder_length=True,
)
然后我们创建一个验证TimeSeriesDataSet,它具有与训练数据集对象相同的参数,如下所示:
# create validation set (predict=True)
validation_dataset = TimeSeriesDataSet.from_dataset(
  training_dataset, # dataset from which to copy parameters (encoders, scalers, ...)
  train, # data from which new dataset will be generated
  predict=True, # predict the decoder length on the last entries in the time index
  stop_randomization=True,
)
类似地,我们使用训练TimeSeriesDataSet对象来创建TFT模型:
# Create network from TimeSeriesDataSet
tft = TemporalFusionTransformer.from_dataset(
    training_dataset,
    learning_rate=0.03,
    hidden_size=16,
    attention_head_size=1,
    dropout=0.1,
    hidden_continuous_size=8,
    output_size=7,  # number of quantiles
    loss=QuantileLoss(),
    log_interval=10,  # logging every 10 batches
    reduce_on_plateau_patience=4,
)
print(f"Number of parameters in network: {tft.size()/1e3:.1f}k")
Pytorch Forecasting实现基于Pytorch Lightning。因此,为了训练模型,我们需要定义Trainer对象和dataloaders。
# define callbacks
early_stop_callback = EarlyStopping(monitor="val_loss", min_delta=1e-4, patience=10, verbose=False, mode="min")
lr_logger = LearningRateMonitor()  # log the learning rate
logger = TensorBoardLogger(save_dir=SAVE_DIR)  # log results to a tensorboard
# create trainer
trainer = pl.Trainer(
    max_epochs=50,
    accelerator="gpu" if torch.cuda.is_available() else "cpu",
    devices=1,
    gradient_clip_val=0.1,
    limit_train_batches=30,  # run valiation every 30 batches
    log_every_n_steps=10,
    # fast_dev_run=True,  # comment in to check that networkor dataset has no serious bugs
    callbacks=[lr_logger, early_stop_callback],
    logger=logger,
)
# create training and validation dataloaders
batch_size = 128
train_dataloader = training_dataset.to_dataloader(train=True, batch_size=batch_size, num_workers=8)
val_dataloader = validation_dataset.to_dataloader(train=False, batch_size=batch_size * 10, num_workers=8)
# fit network
trainer.fit(
    tft,
    train_dataloaders=train_dataloader,
    val_dataloaders=val_dataloader,
)
超参数调优
在上面的代码中,我们使用预先固定的超参数来训练我们的模型。Pytorch Forecasting提出了一个包装器函数,使用Optuna在验证集上对它们进行调优:
# Hyperparameters Tuning with Optuna
# create study
study = optimize_hyperparameters(
    train_dataloader,
    val_dataloader,
    model_path="optuna_test",
    n_trials=200,
    max_epochs=50,
    gradient_clip_val_range=(0.01, 1.0),
    hidden_size_range=(8, 128),
    hidden_continuous_size_range=(8, 128),
    attention_head_size_range=(1, 4),
    learning_rate_range=(0.001, 0.1),
    dropout_range=(0.1, 0.3),
    trainer_kwargs=dict(limit_train_batches=30),
    reduce_on_plateau_patience=4,
    use_learning_rate_finder=False,  # use Optuna to find ideal learning rate or use in-built learning rate finder
)
# pickle study results
with open("study.pkl", "wb") as fout:
    pickle.dump(study, fout)
# show best hyperparameters
study.best_trial.params
验证
训练完成后,我们从具有最佳验证损失的检查点加载模型。
# load the best model w.r.t. the validation loss
best_model_path = trainer.checkpoint_callback.best_model_path
best_tft = TemporalFusionTransformer.load_from_checkpoint(best_model_path)
默认情况下,使用每个时间序列的最后max_prediction_length时间步(365天)进行验证。我们将return_x设置为True以返回输入数据,稍后我们将这些数据绘制在与预测相同的图上。
# get prediction results as a dictionary
val_prediction_results = best_tft.predict(val_dataloader, mode="raw", return_x=True)
# Plot actuals vs prediction and attention
for idx in range(val_predictions.prediction.shape[0]): # nb of groups combinations
    fig, ax = plt.subplots(figsize=(23,5))
    best_tft.plot_prediction(val_prediction_results.x, # network input
                            val_prediction_results.output, # network output
                            idx=idx,
                            add_loss_to_title=True,
                            ax=ax);

灰线显示了不同时间点的注意权重。探索这些权重可以用于改进模型。例如,如果注意力峰值位于回溯窗口的开始处,则应增加此窗口的大小,以包括所有相关的过去时间步。
推断2021年的销售量
现在,我们将推断每个独立时间序列在2021年的销售量。为此,我们需要将训练数据集与静态协变量和2021年的时间变化已知值连接起来。在我们的情况下,这包括已知的日历特征。
# add calendar features
test = add_cyclical_calendar_features(test_df.set_index("date"), features=["weekday", "week"])
test["weekend"] = (test.index.dayofweek > 4).astype(int)
# add holidays flag
holidays_dates_per_country = {}
for country in test["country"].unique():
    holidays_dates_per_country[country]=[tuple[0] for tuple in list(getattr(holidays, country)(years=set(test.index.year)).items())]
    test.loc[test["country"]==country, "holidays"]=test.loc[test["country"]==country].index.isin(holidays_dates_per_country[country])
test["holidays"] = test["holidays"].astype(int)
# add end-of-year holidays flag
test["newyear"]=0
for day in range(25,32):
    test.loc[(test.index.month == 12) & (test.index.day == day),"newyear"]=1
# Add required time_idx column w.r.t to last time index of training df
test = test.reset_index()
test = (test.merge((test[['date']].drop_duplicates(ignore_index=True).rename_axis('time_idx')).reset_index(), on = ['date']))
test["time_idx"]+=train["time_idx"].max()+1
# Drop unused columns
test = test.drop(["date", "row_id"], axis=1)
# Vertically stack the test df at the end of the training df
test = pd.concat([train, test], ignore_index=True).fillna(0.0)
然后,我们创建一个TimeSeriesDataSet对象,一个测试集的数据加载器,并启动预测循环。
# Create test dataset
test_dataset = TimeSeriesDataSet.from_dataset(training_dataset,
                                        test,
                                        predict=True,
                                        stop_randomization=True)
# Create test dataloader
test_dataloader = test_dataset.to_dataloader(train=False, batch_size=batch_size, num_workers=8)
# Get prediction results
test_prediction_results = best_tft.predict(
    test_dataloader,
    mode="raw",
    return_index=True, # return the prediction index in the same order as the output
    return_x=True, # return network inputs in the same order as prediction output
    )

2021个预测是形状<组组合数量,时间步数,分位数数量>

为了能够构建预测数据框架并将每个预测值与其对应的商店、国家和产品关联起来,我们需要找出与预测张量的第一个维度相关的组组合。为此,我们将return_index设置为True。
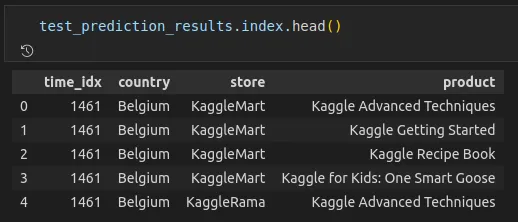
索引数据帧中的time_idx对应于第一个预测的time_idx。
# Create predictions dataframe
predictions_df = test_df.copy()
# Add num_sold column
predictions_df["num_sold"]=np.nan
# get 0.5 quantile (median) predictions
median_predictions = test_prediction_results.output.prediction.cpu().numpy()[:,:,4]
# add sales predictions w.r.t to groups combination
for i, row in test_prediction_results.index.iterrows():
    predictions_df.loc[
        (predictions_df["country"]==row["country"]) &
        (predictions_df["store"]==row["store"]) &
        (predictions_df["product"]==row["product"]),
        "num_sold"] = median_predictions[i]
可解释性
可解释性是Temporal Fusion Transformer的一个重要特性。Pytorch Forecasting提供了实用函数,用于从训练好的模型获取和绘制解释结果。
TFT中的可解释性通过以下方式实现:
1. 多头注意机制中的共享权重,可以追溯到最相关的历史数据点。之前在验证部分已经展示了与回溯窗口中每个数据点相关的注意权重(灰线)。
2.特殊的变量选择块,用于衡量每个输入变量的重要性。你可以从预测结果字典中获取学习到的权重。
# plot variable importance
interpretation = best_tft.interpret_output(
  val_predictions,
  reduction="sum", # sum attentions
)
best_tft.plot_interpretation(interpretation)
Pytorch预测还提供了一个函数来交叉绘制预测与不同变量的实际值,以检测残差和输入特征之间可能的依赖关系。这可能会指导解释性特征识别步骤。
val_prediction_results = best_tft.predict(
    val_dataloader,
    mode="prediction", # get only median predictions
    return_x=True,
    )
predictions_vs_actuals = best_tft.calculate_prediction_actual_by_variable(val_prediction_results.x, val_prediction_results.output)
# remove added lagged features
features = list(set(predictions_vs_actuals['support'].keys())-set(['num_sold_lagged_by_365', 'num_sold_lagged_by_7']))
# plot cross_plots
for feature in features:
    best_tft.plot_prediction_actual_by_variable(predictions_vs_actuals, name=feature);
总结
Pytorch Forecasting是一款开源的Python库。它提供了基于Pytorch Lightning的Temporal Fusion Transformer的实现。它支持使用Optuna进行超参数调优,并且可以可视化内在的可解释性属性。
除了TFT,Pytorch Forecasting还提供了其他时间序列预测深度学习模型的实现,比如DeepAR、N-BEATS和N-HiTS。


