使用Matplotlib和Seaborn创建视觉效果
数据可视化在数据工作中至关重要,因为它可以帮助人们了解我们的数据会发生什么。很难直接以原始形式摄取数据信息,但可视化会激发人们的兴趣和参与度。这就是为什么学习数据可视化对于在数据领域取得成功很重要的原因。
Matplotlib是Python最受欢迎的数据可视化库之一,因为它非常通用,你可以从头开始可视化几乎所有内容。 你可以使用此软件包控制可视化的许多方面。
另一方面,Seaborn是一个构建在Matplotlib之上的Python数据可视化包。 它提供了更简单的高级代码,包内有各种内置主题。 如果你想要一个快速的数据可视化和漂亮的外观,这个包是很棒的。
在本文中,我们将探索这两个包,并学习如何使用这些包可视化数据。
使用 Matplotlib 进行可视化
如上所述,Matplotlib是一个通用的Python包,我们可以在其中控制可视化的各个方面。该软件包基于 Matlab 编程语言,但我们在 Python 中应用了它。
pip install matplotlib
Matplotlib 库通常已经在你的环境中可用,尤其是在你使用 Anaconda 的情况下。如果没有,你可以使用以下代码安装它们。
import matplotlib.pyplot as plt
import numpy as np


x = np.linspace(0,5,21)

y = x**2
plt.plot(x, y, 'b')

plt.xlabel('X Axis')

plt.ylabel('Y Axis')

plt.title('Sample Plot')
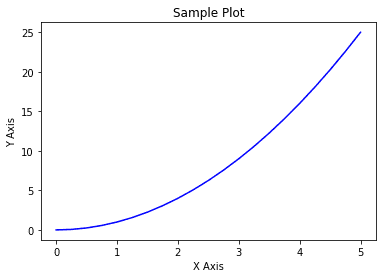
在上面的代码中,我们将数据传递到 matplotlib 函数(x 和 y)中,以创建带有蓝线的简单线图。此外,我们使用上面的代码控制轴标签和标题。
让我们尝试使用子图函数创建一个多 matplotlib 图。
plt.subplot(1,2,1)

plt.plot(x, y, 'b--')

plt.title('Subplot 1')

plt.subplot(1,2,2)

plt.plot(x, y, 'r')

plt.title('Subplot 2')
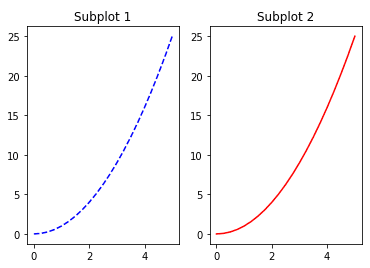
在上面的代码中,我们并排创建了两个图。 子图功能控制出图位置;例如plt.subplot(1,2,1)意味着我们将在一行(第一个参数)和两列(第二个参数)中有两个图。 第三个参数是控制我们现在引用的图。 所以plt.subplot(1,2,1)表示单行双列图的第一个图。
这是Matplotlib函数的基础,但是如果我们想要更多地控制Matplotlib可视化,我们需要使用面向对象方法(OOM)。 使用OOM,我们将直接从图形对象生成可视化,并从指定对象调用任何属性。
下面这个是一个Matplotlib OOM的可视化示例。
#create figure instance (Canvas)

fig = plt.figure()


#add the axes to the canvas

ax = fig.add_axes([0.1, 0.1, 0.7, 0.7]) #left, bottom, width, height (range from 0 to 1)


#add the plot to the axes within the canvas

ax.plot(x, y, 'b')

ax.set_xlabel('X label')

ax.set_ylabel('Y label')

ax.set_title('Plot with OOM')
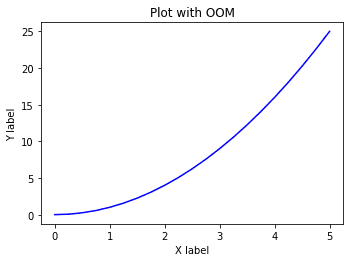
结果与我们创建的图类似,但代码更复杂。 起初,它似乎适得其反,但使用OOM允许我们通过可视化控制几乎所有的事情。 例如,在上面的图中,我们可以控制坐标轴在画布中的位置。
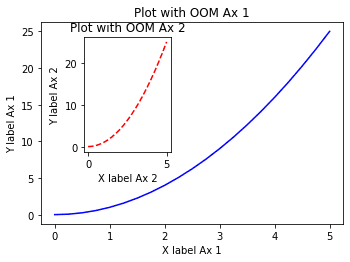
为了了解使用OOM与使用普通绘图函数的区别,让我们将两个绘图的轴彼此重叠。
#create figure instance (Canvas)

fig = plt.figure()


#add two axes to the canvas

ax1 = fig.add_axes([0.1, 0.1, 0.7, 0.7])

ax2 = fig.add_axes([0.2, 0.35, 0.2, 0.4])


#add the plot to the respective axes within the canvas

ax1.plot(x, y, 'b')

ax1.set_xlabel('X label Ax 1')

ax1.set_ylabel('Y label Ax 1')

ax1.set_title('Plot with OOM Ax 1')


ax2.plot(x, y, 'r--')

ax2.set_xlabel('X label Ax 2')

ax2.set_ylabel('Y label Ax 2')

ax2.set_title('Plot with OOM Ax 2')
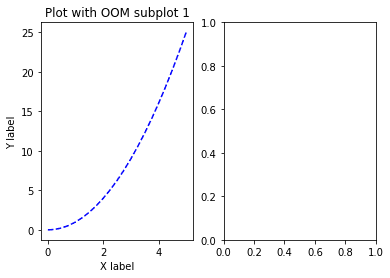
fig, ax = plt.subplots(nrows = 1, ncols =2)


ax[0].plot(x, y, 'b--')

ax[0].set_xlabel('X label')

ax[0].set_ylabel('Y label')

ax[0].set_title('Plot with OOM subplot 1')
fig, axes = plt.subplots(nrows = 1, ncols =2)


for ax in axes:


    ax.plot(x, y, 'b--')

    ax.set_xlabel('X label')

    ax.set_ylabel('Y label')

    ax.set_title('Plot with OOM')


plt.tight_layout()
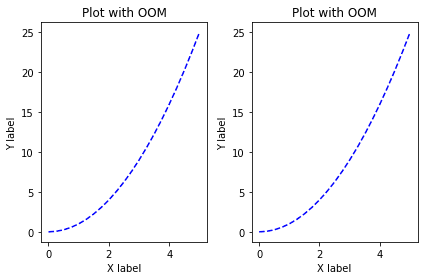
fig = plt.figure(figsize = (8,4), dpi =100)
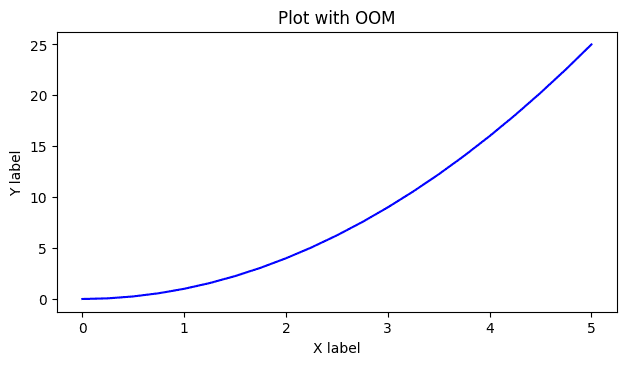
fig.savefig('visualization.jpg')
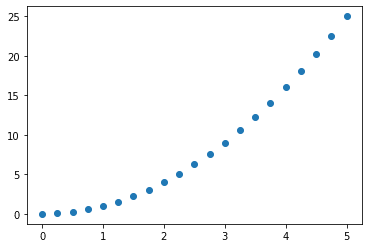
plt.scatter(x,y)
plt.hist(y, bins = 5)
plt.boxplot(x)
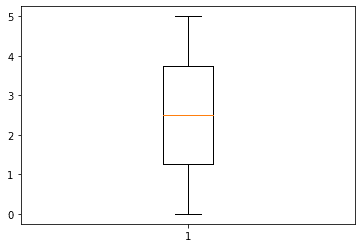
freq = [2,4,1,3]

fruit = ['Apple', 'Banana', 'Grape', 'Pear']

plt.pie(freq, labels = fruit)
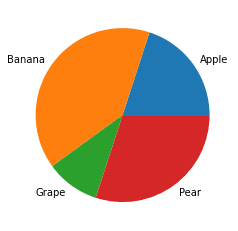
pip install seaborn
import seaborn as sns


tips = sns.load_dataset('tips')

tips.head()
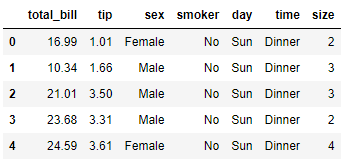
sns.displot(data = tips, x = 'tip')
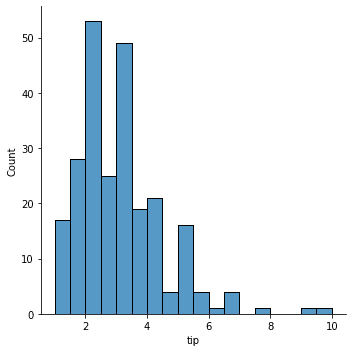
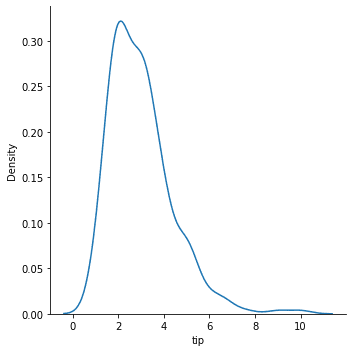
sns.displot(data = tips, x = 'tip', kind = 'kde')
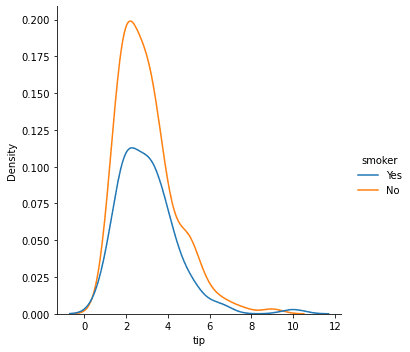
sns.displot(data = tips, x = 'tip', kind = 'kde', hue = 'smoker')
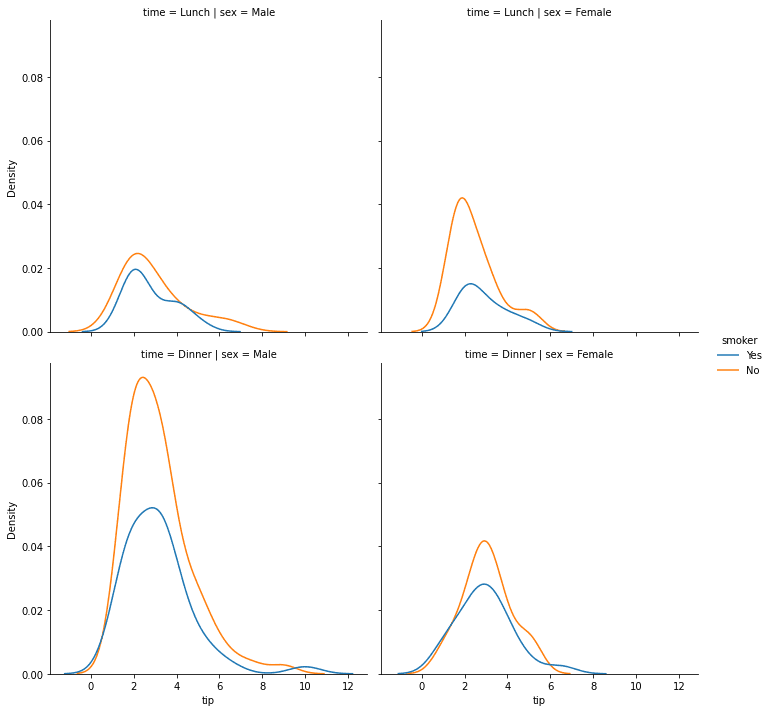
sns.displot(data = tips, x = 'tip', kind = 'kde', hue = 'smoker', row = 'time', col = 'sex')
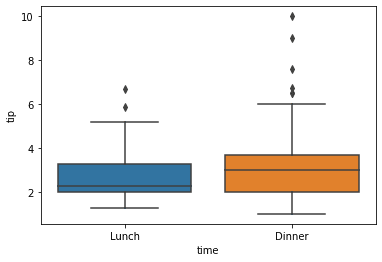
sns.boxplot(data = tips, x = 'time', y = 'tip')
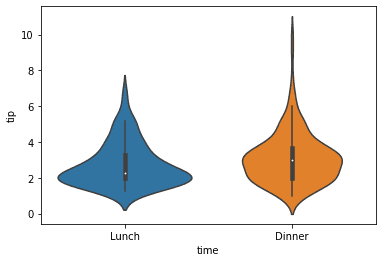
sns.violinplot(data = tips, x = 'time', y = 'tip')

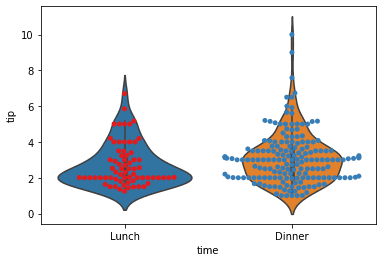
sns.swarmplot(data = tips, x = 'time', y = 'tip', palette = 'Set1')
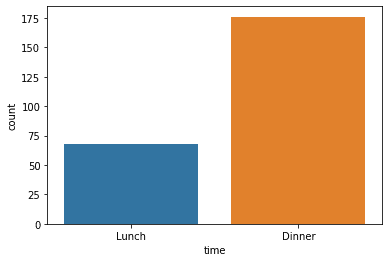
sns.countplot(data = tips, x = 'time')
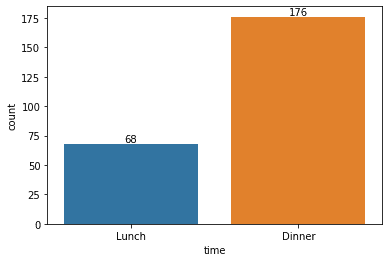
p = sns.countplot(data = tips, x = 'time')

p.bar_label(p.containers[0])
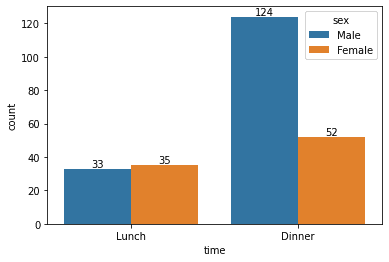
p = sns.countplot(data = tips, x = 'time', hue = 'sex')

for container in p.containers:

    ax.bar_label(container)
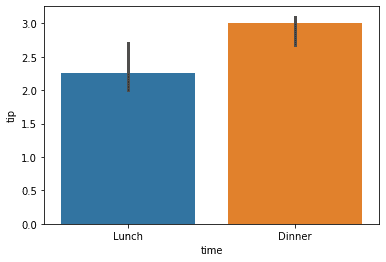
sns.barplot(data = tips, x = 'time', y = 'tip')
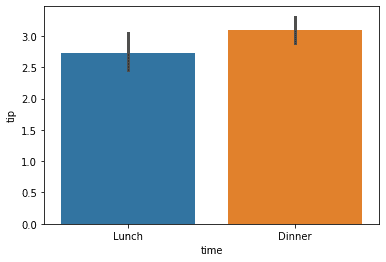
import numpy as np

sns.barplot(data = tips, x = 'time', y = 'tip', estimator = np.median)
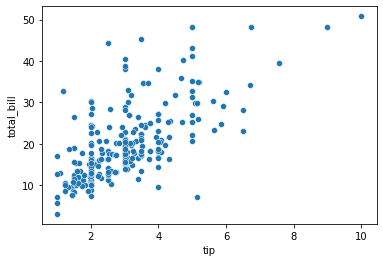
sns.scatterplot(data = tips, x = 'tip', y = 'total_bill')
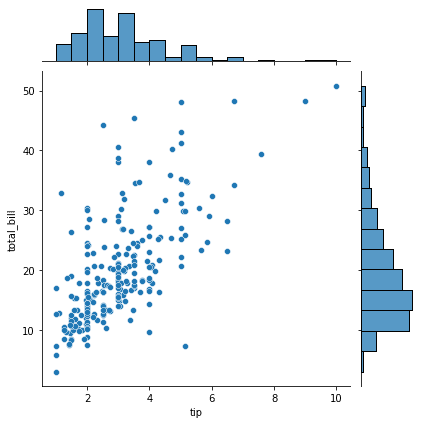
sns.jointplot(data = tips, x = 'tip', y = 'total_bill')
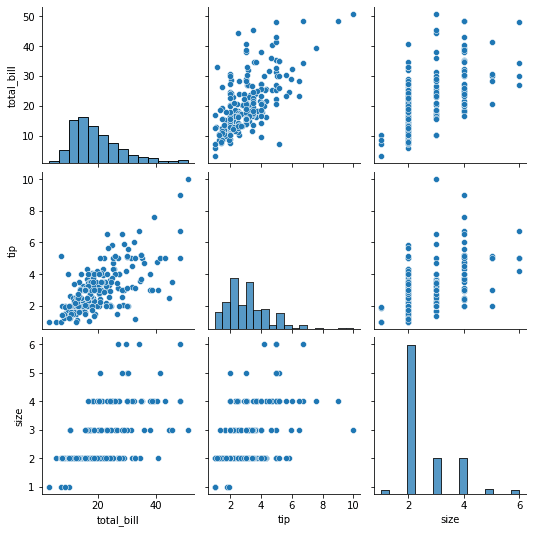
sns.pairplot(data = tips)
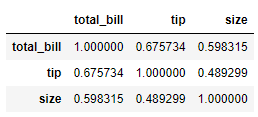
tips.corr()
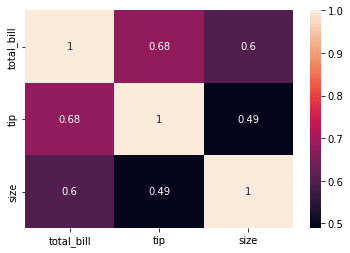
sns.heatmap(tips.corr(), annot = True)
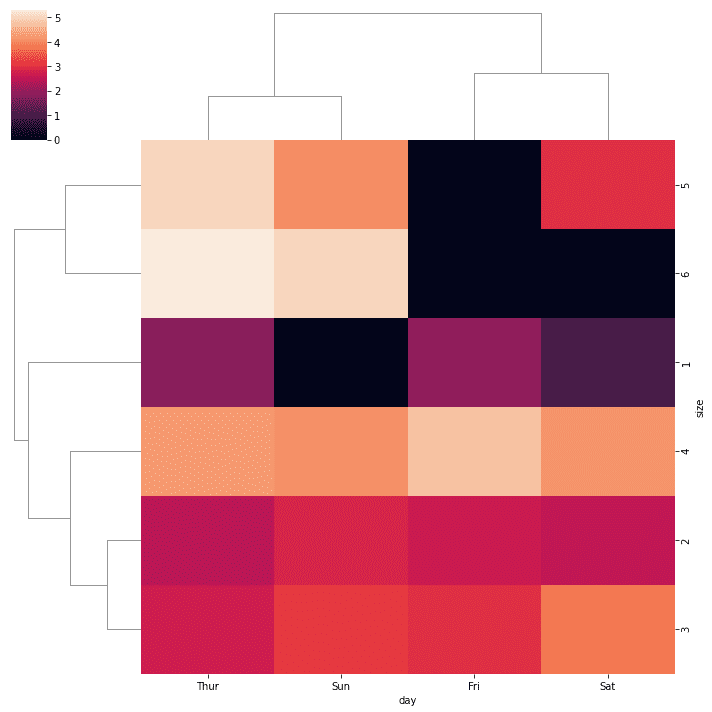
sns.clustermap(tips.pivot_table(values = 'tip', index = 'size', columns = 'day').fillna(0))
