机器学习中的特征选择技术解析
如果你正在使用数据集并尝试构建一个机器学习模型,你可能并不需要所有的数据和列用于模型训练。使用不必要的数据可能会使模型困惑,并导致不可取的结果,如过度拟合或欠拟合。
那么,如何选择对模型影响最大的正确列和数据呢?在本文中,我们将回答这个问题。
选择正确的特征选择方法就像在视频游戏中选择正确的武器一样。它完全取决于你的数据和项目本身的目标。
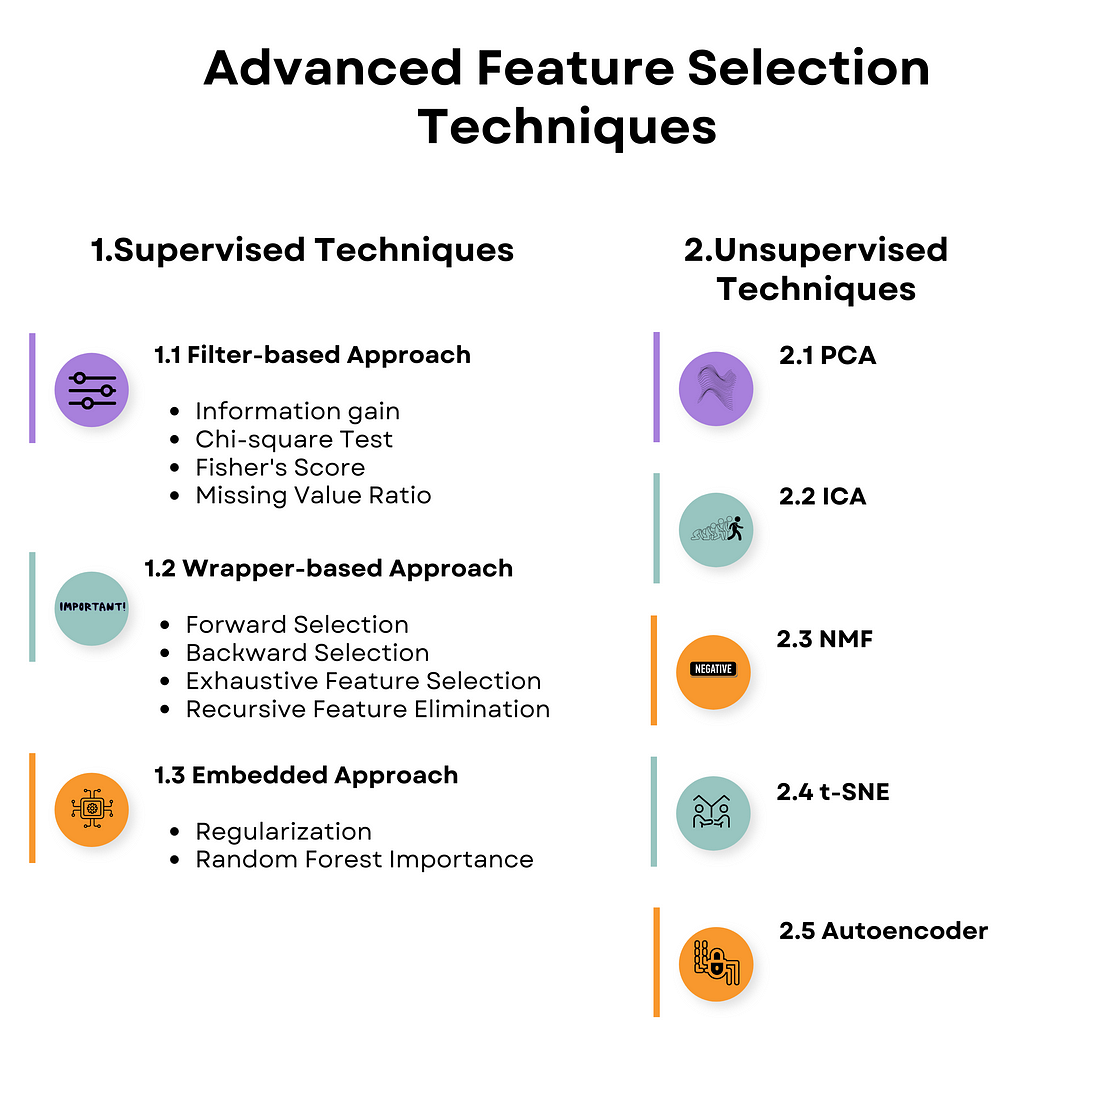
特征选择的两个主要类别是有监督和无监督的机器学习技术。以下是概述。
监督学习与无监督学习
监督学习意味着你将使用有标签的数据来训练算法,并预测未见数据的输出。另一方面,无监督机器学习处理无标签的数据,并旨在发现其中的隐藏模式。
机器学习中的有监督特征选择技术
有监督特征选择是机器学习中一种通过目标变量(即你想预测的输出)来指导数据中相关特征(变量,预测变量)选择的过程。
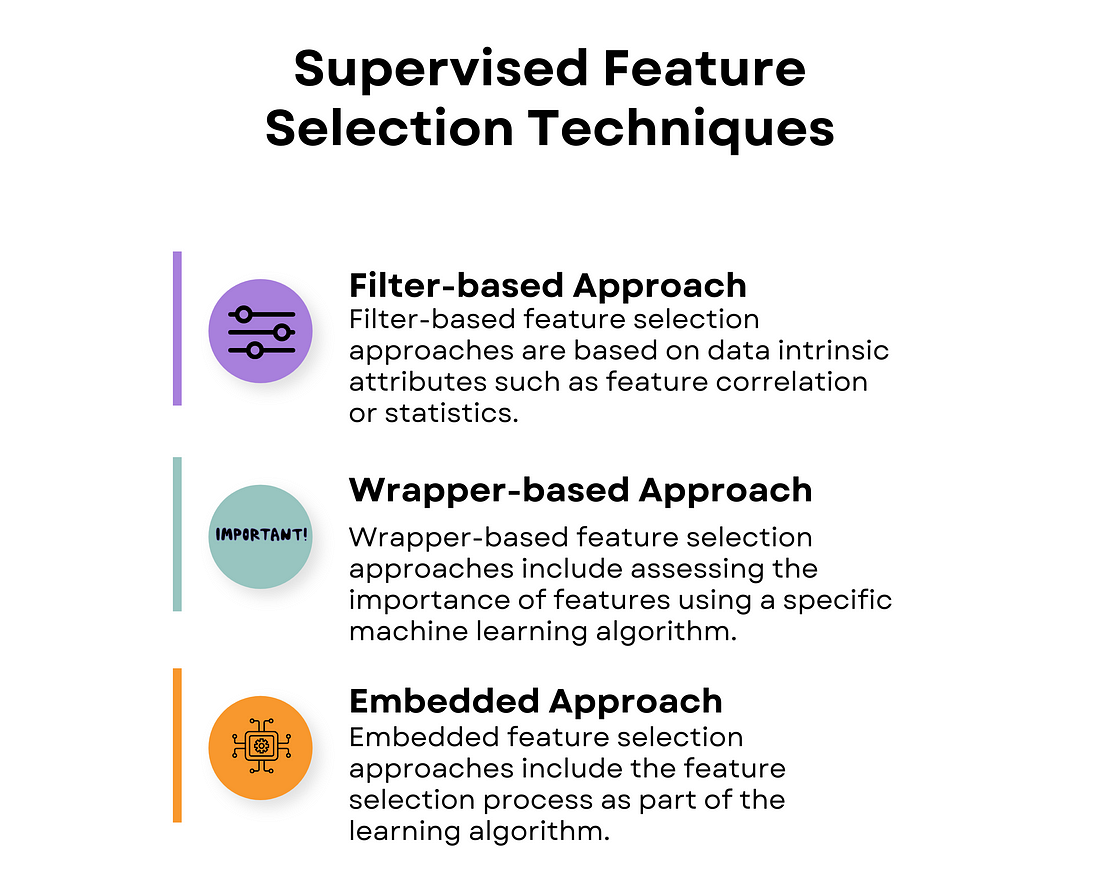
我们将讨论的三种有监督特征选择技术分别是基于过滤器的、基于包装器的和嵌入式方法。
机器学习中的基于过滤器的特征选择技术
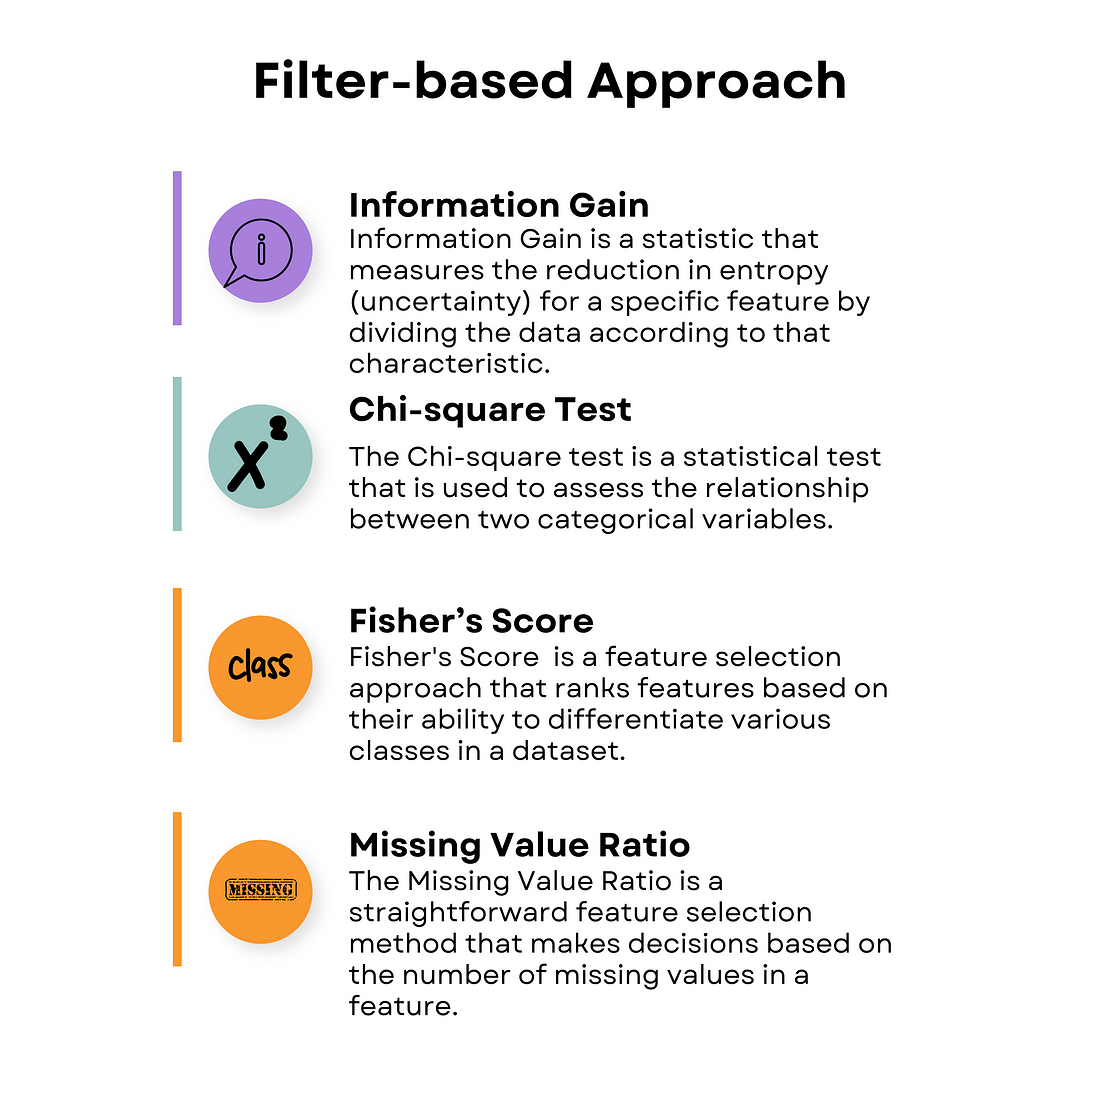
基于过滤器的方法评估每个特征的价值,而不考虑特定机器学习算法的性能。你只评估数据本身,以了解数据之间的相关性。在基于过滤器的方法中,有四种特征选择技术。
信息增益
信息增益是我们观察不同事物,并确定哪些对于寻找答案最有帮助的过程。
这就好像根据颜色或形状将玩具分成不同的组,以找出最有趣的玩具。
你的代码可能看起来像这样。
import numpy as np
import matplotlib.pyplot as plt
from sklearn.datasets import load_diabetes
from sklearn.feature_selection import mutual_info_regression
# Load the diabetes dataset
data = load_diabetes()
# Split the dataset into features and target
X = data.data
y = data.target
# Apply Information Gain
ig = mutual_info_regression(X, y)
# Create a dictionary of feature importance scores
feature_scores = {}
for i in range(len(data.feature_names)):
    feature_scores[data.feature_names[i]] = ig[i]
# Sort the features by importance score in descending order
sorted_features = sorted(feature_scores.items(), key=lambda x: x[1], reverse=True)
# Print the feature importance scores and the sorted features
for feature, score in sorted_features:
    print("Feature:", feature, "Score:", score)
# Plot a horizontal bar chart of the feature importance scores
fig, ax = plt.subplots()
y_pos = np.arange(len(sorted_features))
ax.barh(y_pos, [score for feature, score in sorted_features], align="center")
ax.set_yticks(y_pos)
ax.set_yticklabels([feature for feature, score in sorted_features])
ax.invert_yaxis()  # Labels read top-to-bottom
ax.set_xlabel("Importance Score")
ax.set_title("Feature Importance Scores (Information Gain)")
# Add importance scores as labels on the horizontal bar chart
for i, v in enumerate([score for feature, score in sorted_features]):
    ax.text(v + 0.01, i, str(round(v, 3)), color="black", fontweight="bold")
plt.show()
你有带标签和不带标签的数据,并通过信息增益模型运行它来评估最重要的特征。
然后,输出可能类似于这样。
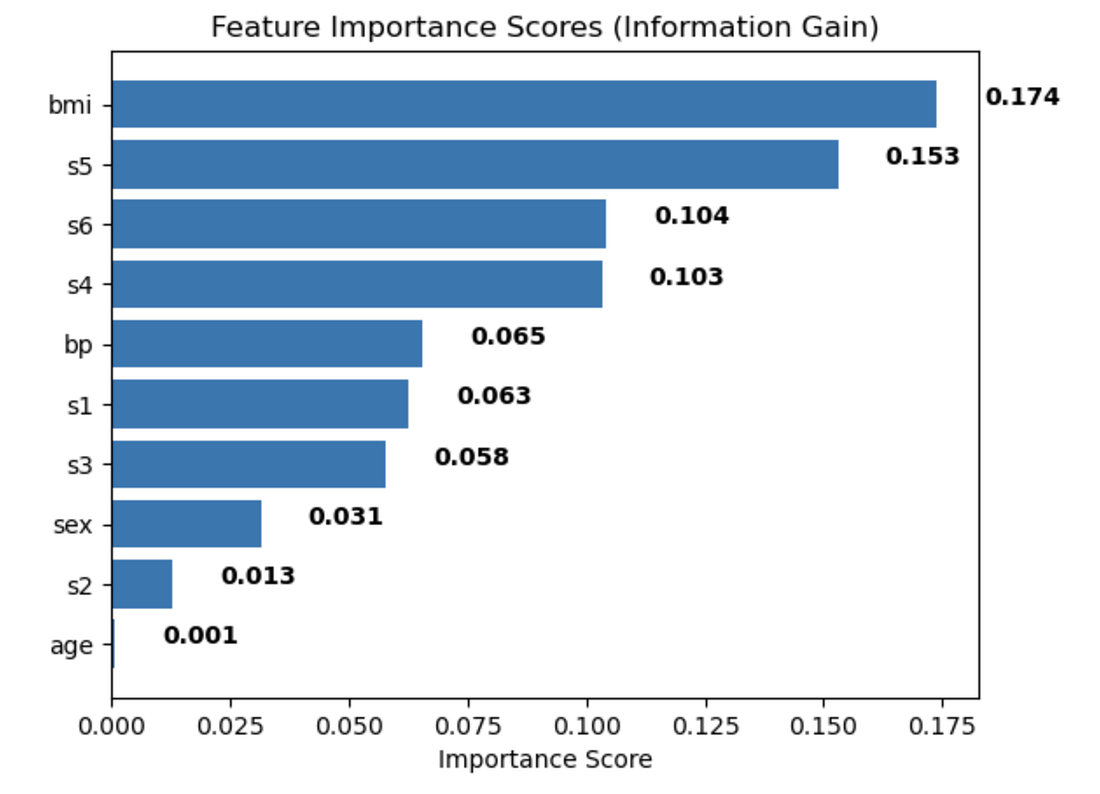
你在可视化图表中看到的数字越高,该特征对于理解导致某种结果(在这种情况下,患上糖尿病)的因素越重要。
卡方检验
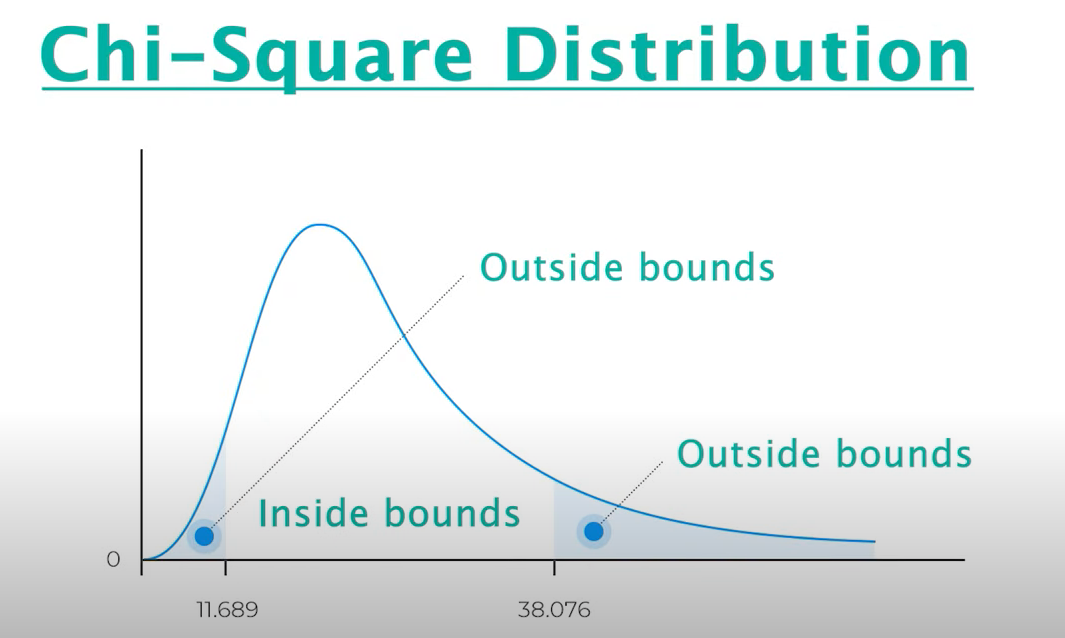
卡方检验是一种简单的统计检验,有助于我们了解事物之间是否相关或仅仅是偶然发生的。
计算公式为:

这就像玩一个游戏,以检验两件事情是否相关,例如吃玉米和感到快乐。
如果特征超出范围,则它们彼此不相关。如果在范围内,则它们是相关的。
Fisher’s Score
是一种找出群体中最重要事物的方法。
这就像根据它们的特殊性给玩具分数一样。拥有更多分数的玩具(或特征)是我们应该关注的,因为它们最有趣。
你的代码和可视化可能如下所示。
from skfeature.function.similarity_based import fisher_score
import matplotlib.pyplot as plt
%matplotlib inline
# Calculating scores
ranks = fisher_score.fisher_score(X, Y)
# Plotting the ranks
feat_importances = pd.Series(ranks, dataframe.columns[0:len(dataframe.columns)-1])
feat_importances.plot(kind='barh', color = 'teal')
plt.show()
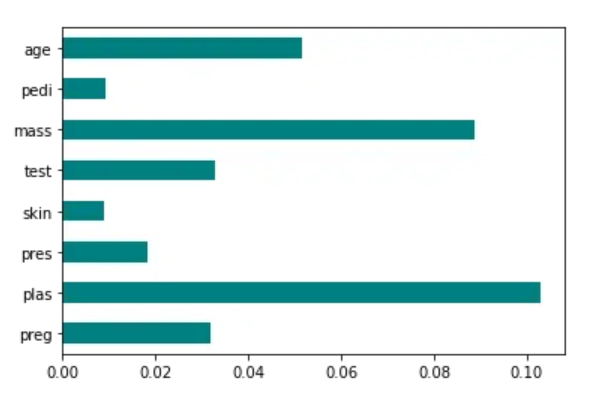
越多的点在图上,该特征就越重要。
缺失值比率
缺失值比率是一种用来找出群体中有多少东西是缺失的方法。这有点像计算一张拼图缺少多少块拼图。如果缺失太多拼图,那么完成拼图并理解整个图景可能会很困难。
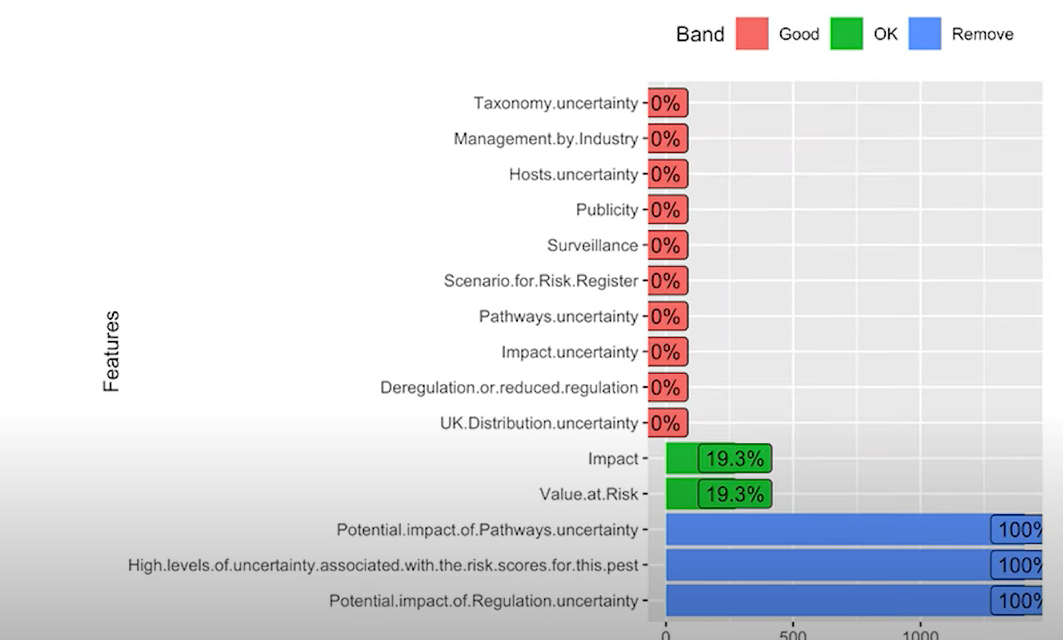
同样,如果有太多的特征缺失数据,这个特征本身可能对模型的工作并不真正有用。
现在让我们来介绍基于包装器的方法!
机器学习中的基于包装器的特征选择技术
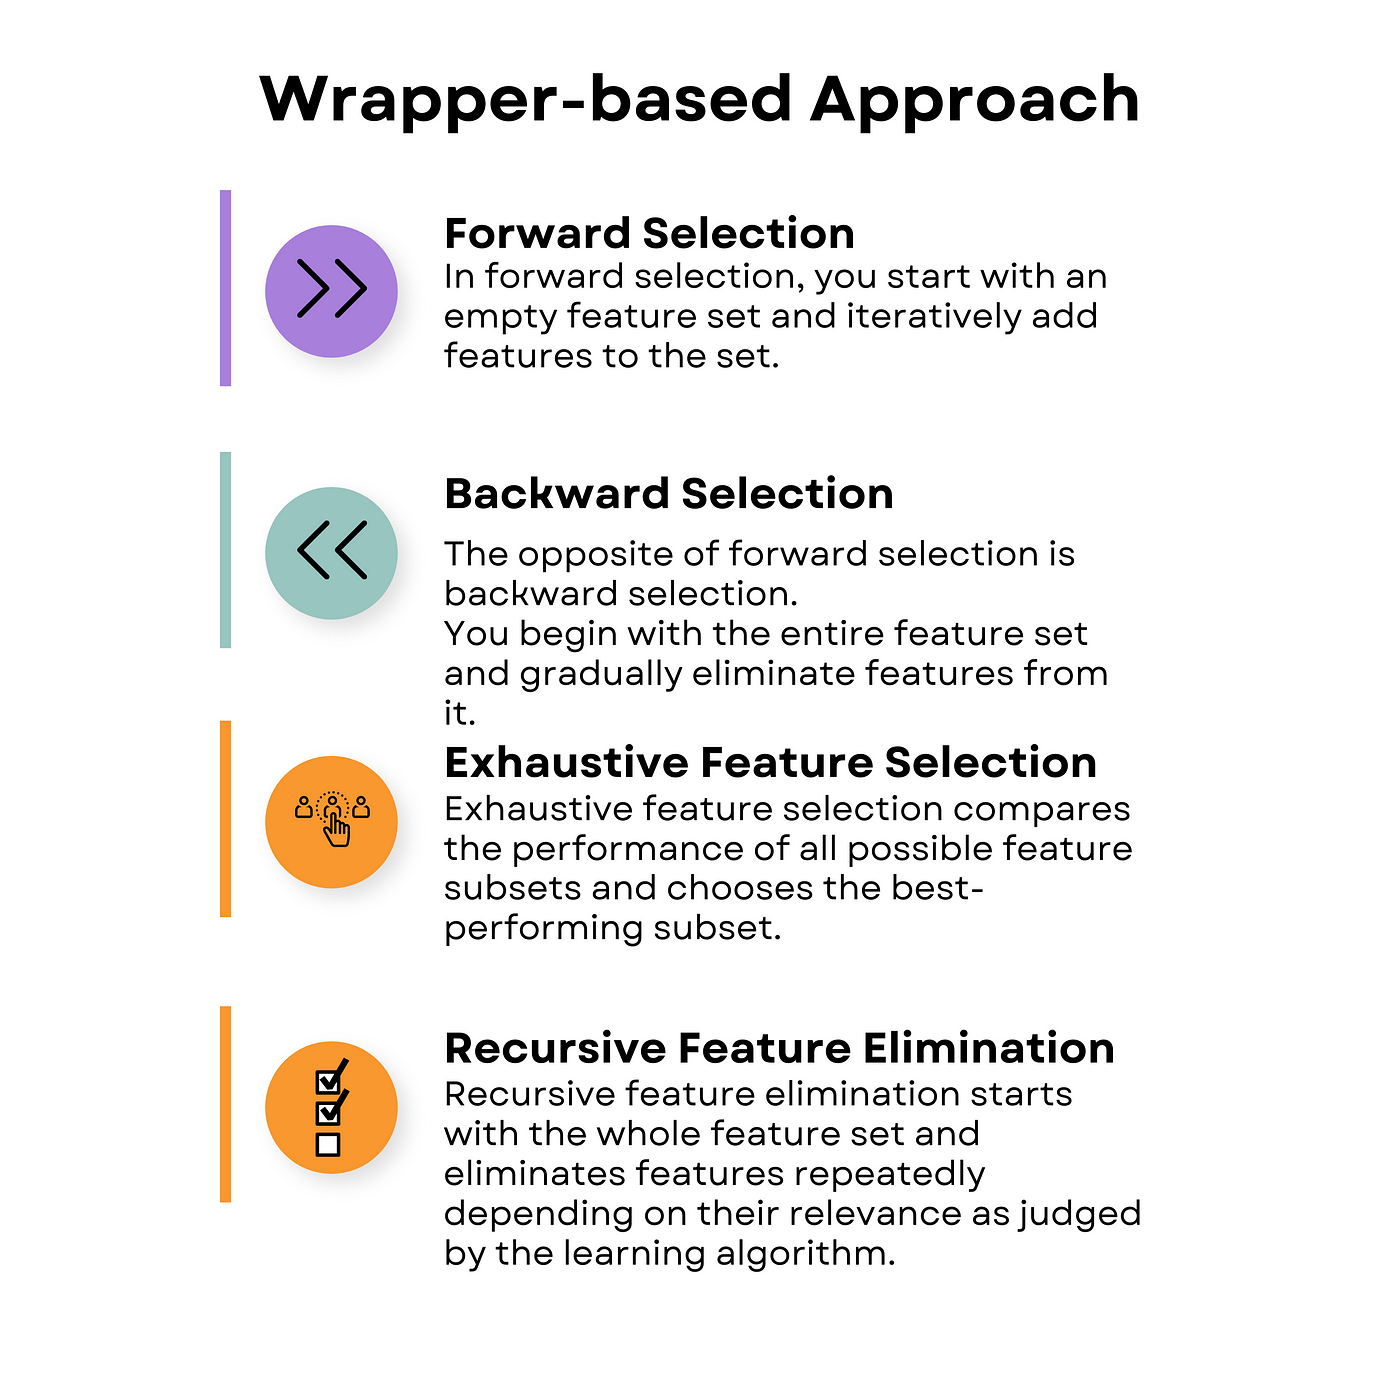
基于包装器的方法可以类比为有一个朋友尝试不同的玩具并告诉你哪些最有趣可玩。在这种情况下,‘帮手’是你要使用的特定机器学习模型,用于确定数据集中最重要的‘玩具’或特征。
下面是四种主要的基于包装器的特征选择技术。
向前选择
按照玩具的类比,从一个玩具开始,看看它有多有趣。然后再添加另一个玩具,看它是否让事情变得更有趣。持续添加玩具,直到获得最有趣的玩具组合。使用逻辑回归来寻找最佳特征的一个例子被给出。一个图表显示,当使用四个特征时,可以达到95%的准确度。
以下是尝试使用逻辑回归找到最佳特征的一些代码。
import numpy as np
import pandas as pd
from sklearn.datasets import load_breast_cancer
from sklearn.linear_model import LogisticRegression
from sklearn.model_selection import train_test_split
from mlxtend.feature_selection import SequentialFeatureSelector as SFS
# Load the breast cancer dataset
data = load_breast_cancer()
# Split the dataset into features and target
X = data.data
y = data.target
# Split the dataset into training and testing sets
X_train, X_test, y_train, y_test = train_test_split(X, y, test_size=0.3, random_state=0)
# Define the logistic regression model
model = LogisticRegression()
# Define the forward selection object
sfs = SFS(model, k_features=5, forward=True, floating=False, scoring="accuracy", cv=5)
# Perform forward selection on the training set
sfs.fit(X_train, y_train)
# Print the selected features
print("Selected Features:", sfs.k_feature_names_)
# Evaluate the performance of the selected features on the testing set
accuracy = sfs.k_score_
print("Accuracy:", accuracy)
# Plot the performance of the model with different feature subsets
sfs_df = pd.DataFrame.from_dict(sfs.get_metric_dict()).T
sfs_df["avg_score"] = sfs_df["avg_score"].astype(float)
fig, ax = plt.subplots()
sfs_df.plot(kind="line", y="avg_score", ax=ax)
ax.set_xlabel("Number of Features")
ax.set_ylabel("Accuracy")
ax.set_title("Forward Selection Performance")
plt.show()
当我们绘制模型所需特征数量与达到特定准确度之间的关系图时,我们得到了这个结果。
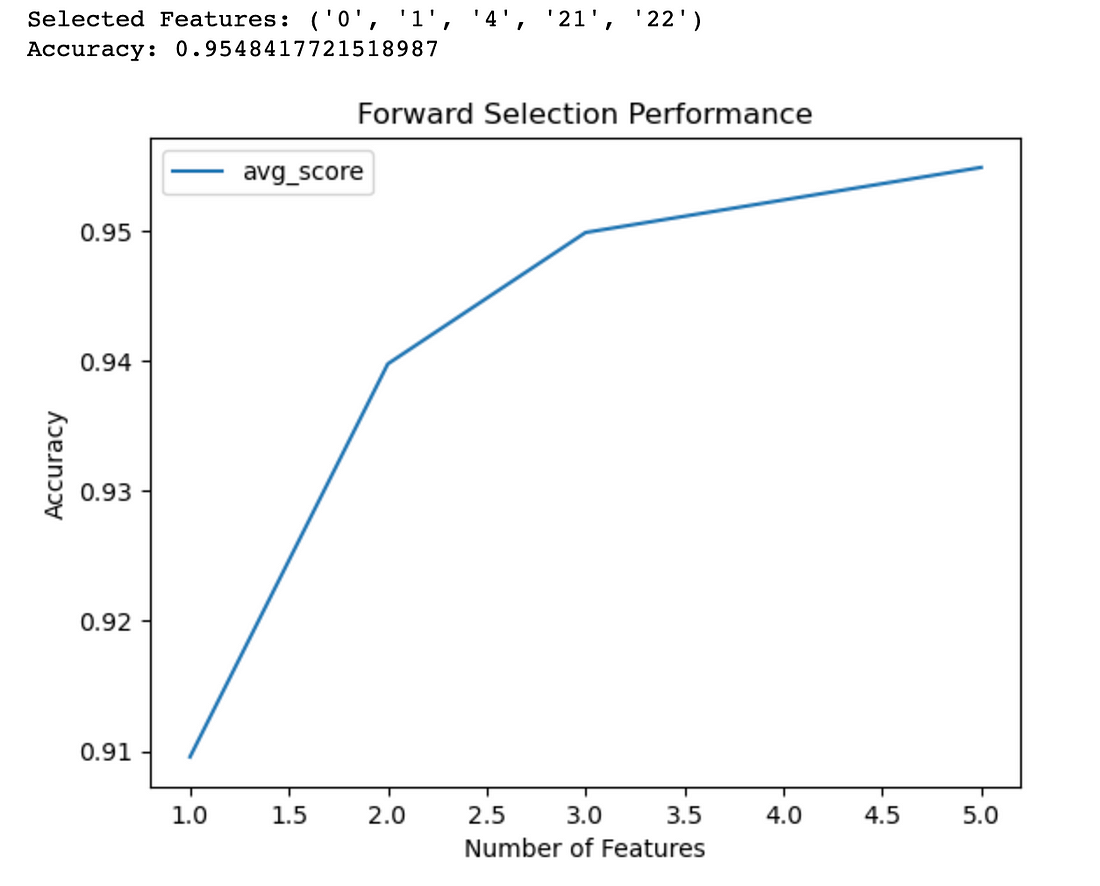
图表显示,例如,如果你有4个特征,你的准确率大约在95%左右。
反向选择
它是正向选择的相反。它从拥有全部特征的集合开始,然后逐个删除特征,删除那些对模型准确率没有贡献的特征,直到得到一个最佳的剩余特征子集。
其可视化如下图所示。
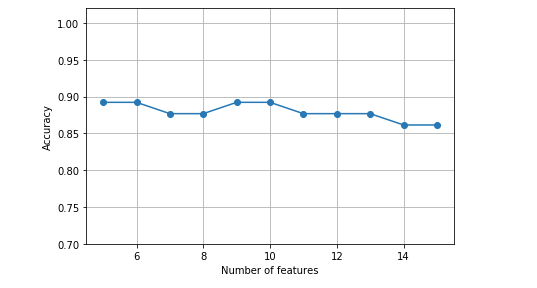
这表明在6到14个特征之间,模型的准确率保持稳定。
详尽的特征选择
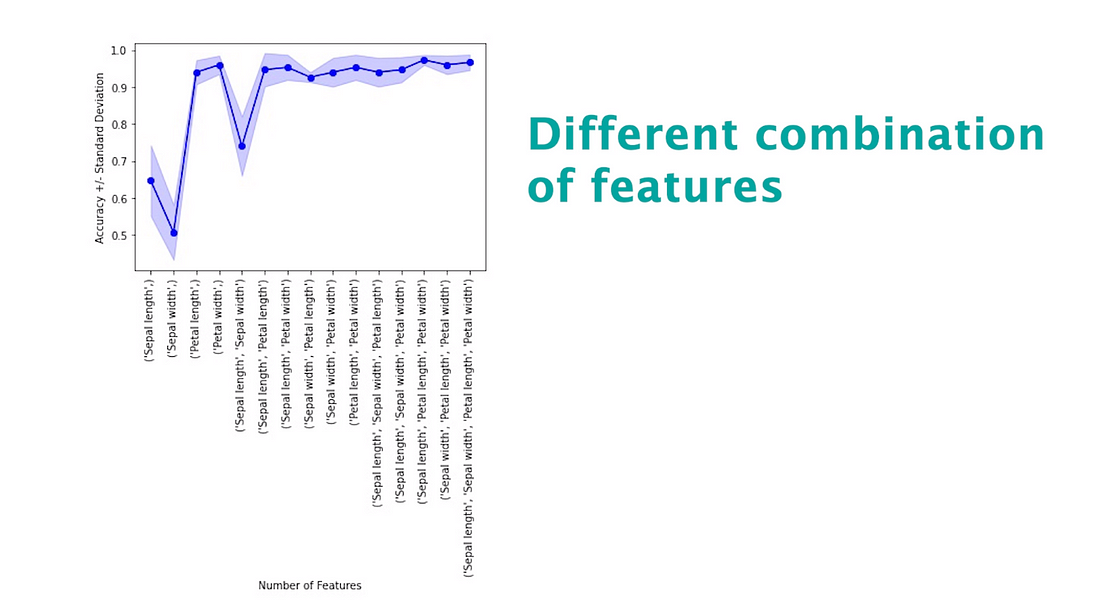
该方法评估所有可能的特征组合,以找出最适合特定机器学习模型的子集。
以下是展示实现的代码。它使用ExhaustiveFeatureSelector函数利用随机森林进行操作。
from mlxtend.feature_selection import ExhaustiveFeatureSelector
from sklearn.ensemble import RandomForestRegressor, RandomForestClassifier
from sklearn.metrics import roc_auc_score
feature_selector = ExhaustiveFeatureSelector(RandomForestClassifier(n_jobs=-1),
           min_features=2,
           max_features=4,
           scoring='roc_auc',
           print_progress=True,
           cv=2)
features = feature_selector.fit(np.array(train_features.fillna(0)), train_labels)
filtered_features= train_features.columns[list(features.k_feature_idx_)]
filtered_features
clf = RandomForestClassifier(n_estimators=100, random_state=41, max_depth=3)
clf.fit(train_features[filtered_features].fillna(0), train_labels)
train_pred = clf.predict_proba(train_features[filtered_features].fillna(0))
print('Accuracy on training set: {}'.format(roc_auc_score(train_labels, train_pred[:,1])))
test_pred = clf.predict_proba(test_features[filtered_features].fillna(0))
print('Accuracy on test set: {}'.format(roc_auc_score(test_labels, test_pred [:,1])))
这种技术可以用以下方式进行可视化。请注意,这只是一个示例,不是上述代码的输出结果。
递归特征消除方法
递归特征消除(Recursive Feature Elimination)是一种特征选择的方法。它首先从一部分特征开始,然后根据它们的重要性添加或删除特征。
可以通过以下方式进行说明。
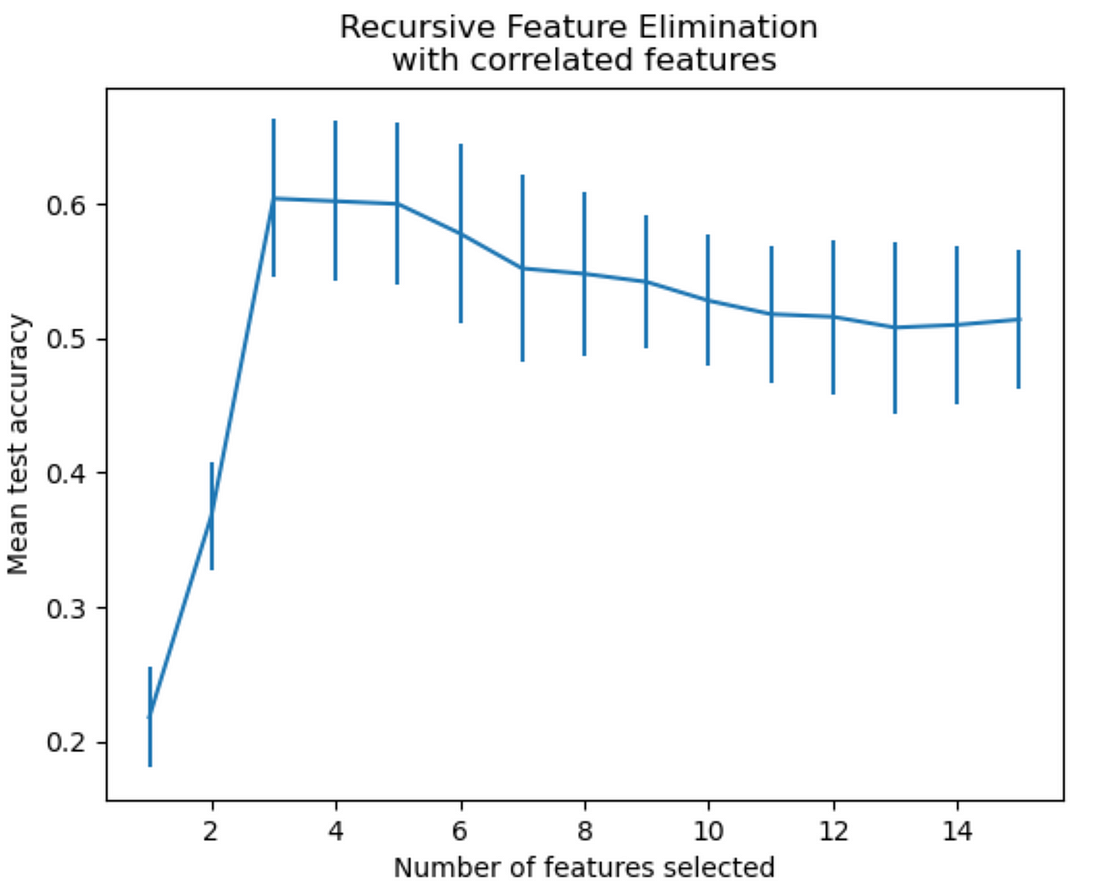
它显示出它根据其重要性添加或删除功能。
嵌入式机器学习特征选择技术
嵌入式方法就像拥有一个聪明的机器人,它可以自己学习和选择最佳的任务特征。机器人在学习过程中构建模型,找出哪些特征最重要,并只保留这些特征。
嵌入式方法中有两种特征选择技术。
正则化
正则化是一种机器学习特征选择技术,就像在骑自行车时系上安全带一样,它可以通过防止你过于快速和失去控制来保持安全。
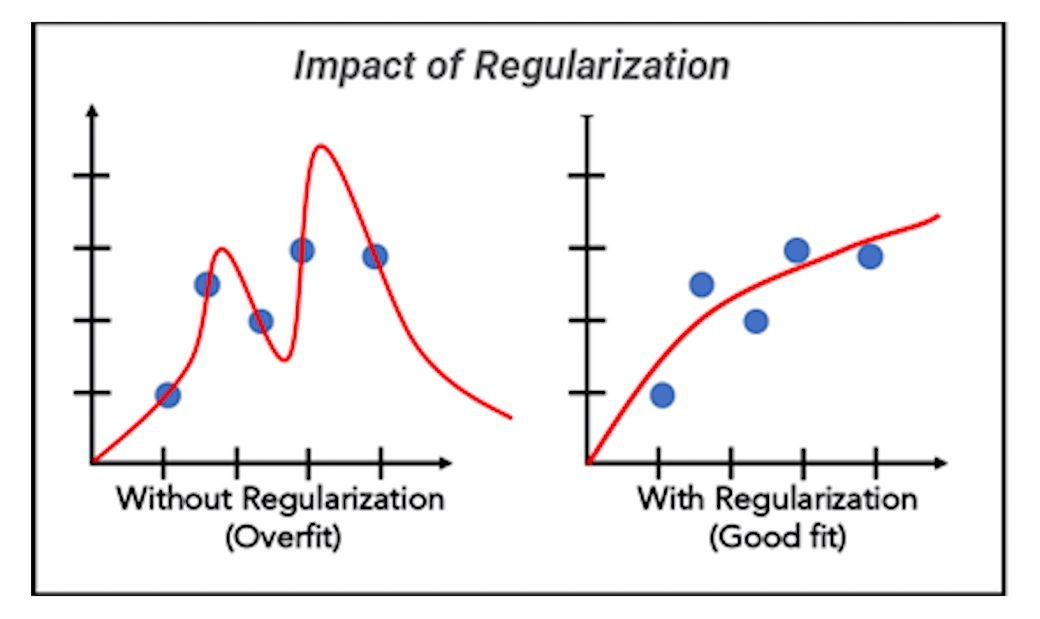
这种技术用于防止模型过于复杂和过拟合数据。
随机森林重要性
随机森林重要性就像询问一组朋友的建议。每个朋友都有自己的观点,有些可能比其他人更有知识。
随机森林重要性考虑了来自不同朋友(也就是决策树)的所有观点,并结合它们来确定决策中哪些因素最为重要。
以下是展示这一过程的代码。
import pandas as pd
import numpy as np
from sklearn.ensemble import RandomForestClassifier
from sklearn.model_selection import train_test_split
import matplotlib.pyplot as plt
# Load the Covertype dataset
data = pd.read_csv(
    "https://archive.ics.uci.edu/ml/machine-learning-databases/covtype/covtype.data.gz",
    header=None,
)
# Assign column names
cols = (
    [
        "Elevation",
        "Aspect",
        "Slope",
        "Horizontal_Distance_To_Hydrology",
        "Vertical_Distance_To_Hydrology",
        "Horizontal_Distance_To_Roadways",
        "Hillshade_9am",
        "Hillshade_Noon",
        "Hillshade_3pm",
        "Horizontal_Distance_To_Fire_Points",
    ]
    + ["Wilderness_Area_" + str(i) for i in range(1, 5)]
    + ["Soil_Type_" + str(i) for i in range(1, 41)]
    + ["Cover_Type"]
)
data.columns = cols
# Split the dataset into features and target
X = data.iloc[:, :-1]
y = data.iloc[:, -1]
# Split the dataset into train and test sets
X_train, X_test, y_train, y_test = train_test_split(
    X, y, test_size=0.3, random_state=42
)
# Create a random forest classifier object
rfc = RandomForestClassifier(n_estimators=100, random_state=42)
# Fit the model to the training data
rfc.fit(X_train, y_train)
# Get feature importances from the trained model
importances = rfc.feature_importances_
# Sort the feature importances in descending order
indices = np.argsort(importances)[::-1]

# Select the top 10 features
num_features = 10
top_indices = indices[:num_features]
top_importances = importances[top_indices]

# Print the top 10 feature rankings
print("Top 10 feature rankings:")
for f in range(num_features):  # Use num_features instead of 10
    print(f"{f+1}. {X_train.columns[indices[f]]}: {importances[indices[f]]}")
# Plot the top 10 feature importances in a horizontal bar chart
plt.barh(range(num_features), top_importances, align="center")
plt.yticks(range(num_features), X_train.columns[top_indices])
plt.xlabel("Feature Importance")
plt.ylabel("Feature")
plt.show()
这是可视化展示
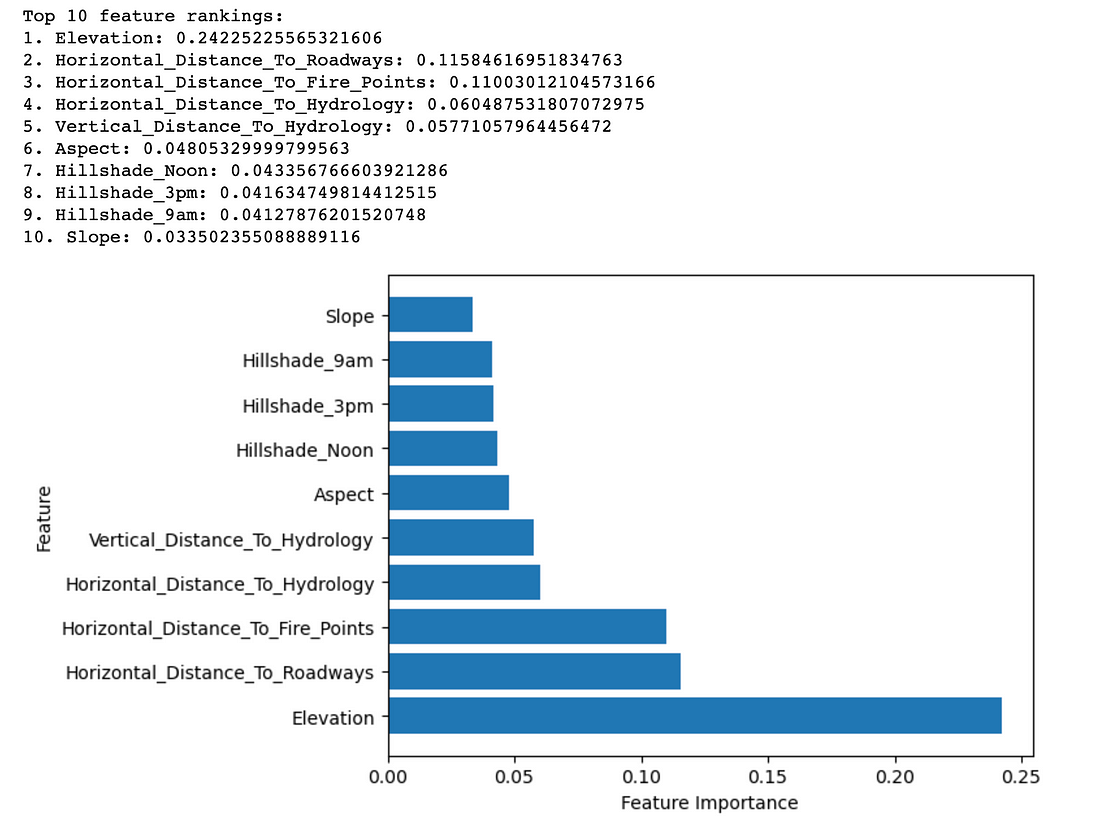
这种技术帮助我们了解哪些特征对结果影响最大。
无监督特征选择技术
简而言之,这些技术是使用算法在没有明确指令的情况下,在数据中找到模式和相似之处。换句话说,不告诉算法什么是好的,什么是不好的,即在没有参考目标变量的情况下选择特征。
这些技术允许你在不使用标记数据的情况下探索和发现重要的数据特征。这些机器学习特征选择技术就像给计算机一个谜题,让它自己找到连接。它们将组织数据并识别相似之处,没有任何帮助。
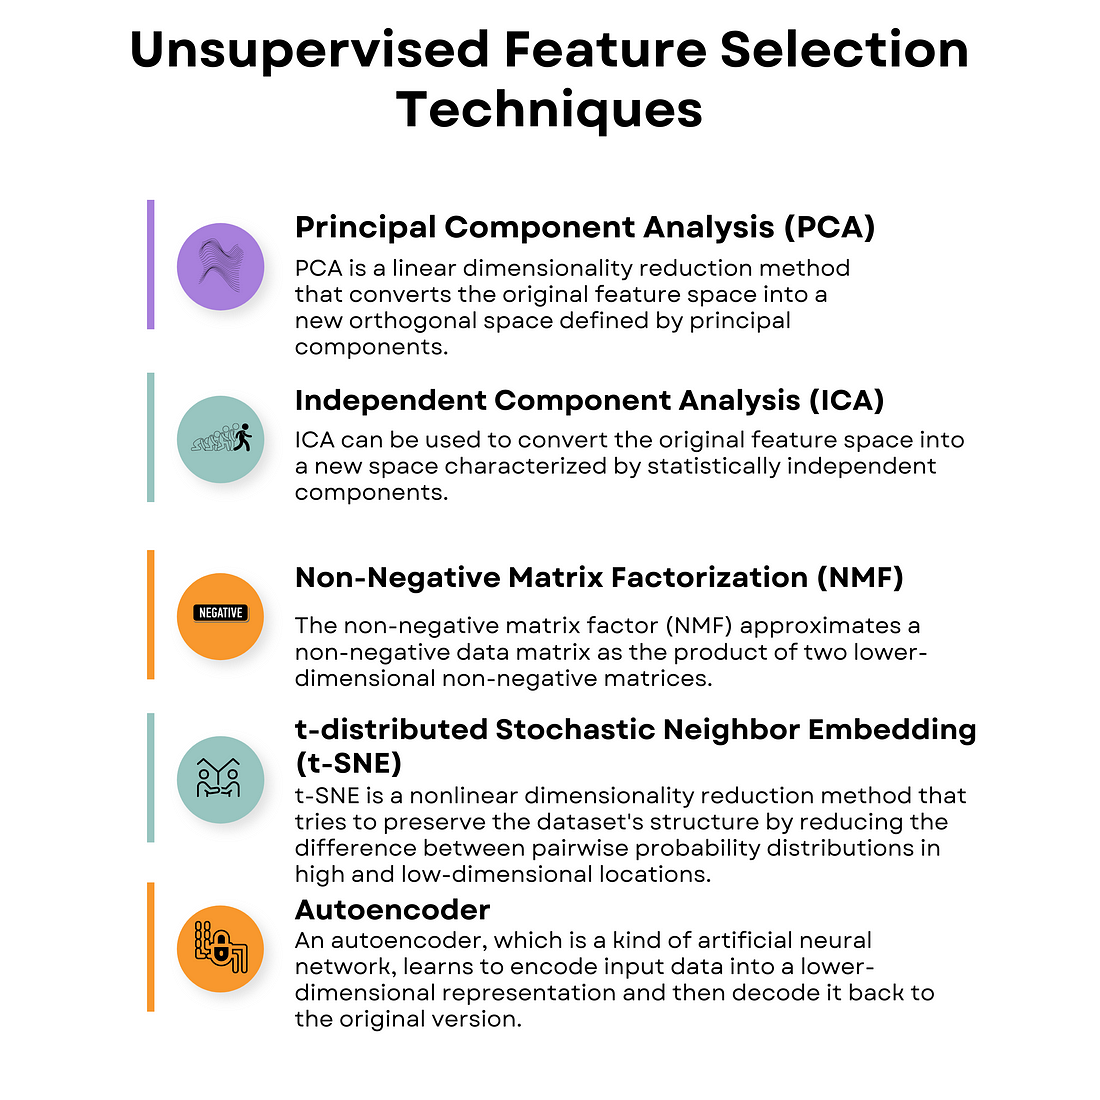
在这一部分,我们将介绍机器学习中的五种非监督特征选择技术。总览如下,请熟悉每种方法,然后我们会解释每一种。
主成分分析(PCA)
主成分分析(PCA)是一种理解和简化数据的方法。它帮助我们找到数据中最重要的部分。想象一下你有一张有很多细节的大图片。PCA帮助我们找出最突出的主要形状或颜色。就像是在不迷失于细节中找出代表整张图片的关键元素。
以下是你的代码示例。导入你的数据并调用PCA函数,你就完成了!编程盲目简单!
import numpy as np
import pandas as pd
import matplotlib.pyplot as plt
from sklearn.datasets import load_wine
from sklearn.decomposition import PCA
from sklearn.preprocessing import StandardScaler
# Load the Wine dataset
wine = load_wine()
X = wine.data
y = wine.target
feature_names = wine.feature_names
# Standardize the features
scaler = StandardScaler()
X_scaled = scaler.fit_transform(X)
# Perform PCA
pca = PCA()
X_pca = pca.fit_transform(X_scaled)
# Calculate the explained variance ratio
explained_variance_ratio = pca.explained_variance_ratio_
# Create a 2x1 grid of subplots
fig, (ax1, ax2) = plt.subplots(nrows=1, ncols=2, figsize=(16, 8))
# Plot the explained variance ratio in the first subplot
ax1.bar(range(1, len(explained_variance_ratio) + 1), explained_variance_ratio)
ax1.set_xlabel("Principal Component")
ax1.set_ylabel("Explained Variance Ratio")
ax1.set_title("Explained Variance Ratio by Principal Component")
# Calculate the cumulative explained variance
cumulative_explained_variance = np.cumsum(explained_variance_ratio)
# Plot the cumulative explained variance in the second subplot
ax2.plot(
    range(1, len(cumulative_explained_variance) + 1),
    cumulative_explained_variance,
    marker="o",
)
ax2.set_xlabel("Number of Principal Components")
ax2.set_ylabel("Cumulative Explained Variance")
ax2.set_title("Cumulative Explained Variance by Principal Components")
# Display the figure
plt.tight_layout()
plt.show()
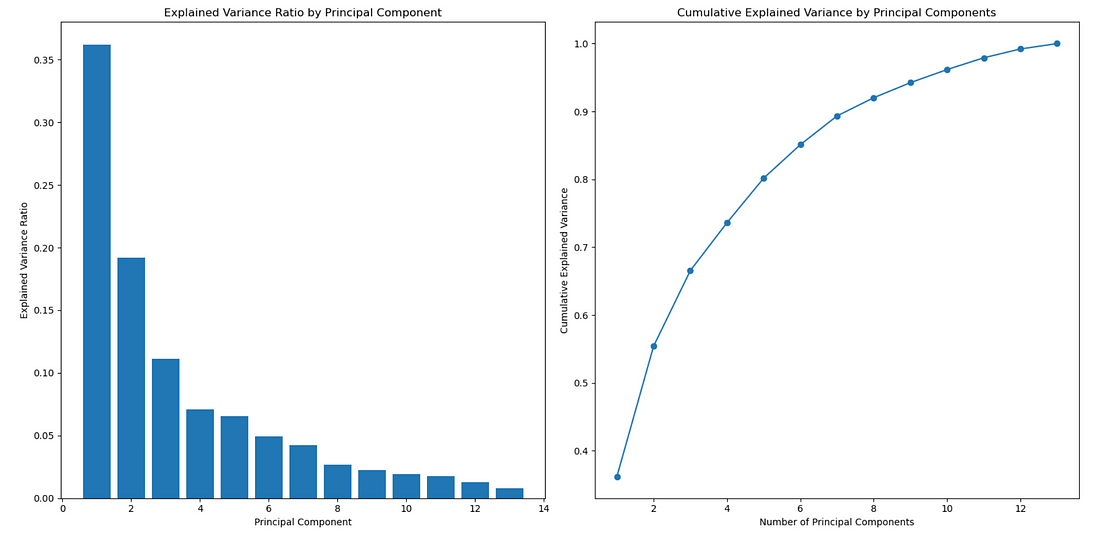
PCA输出是一张图,显示累计方差,并帮助你确定多少个特征或主成分代表你的数据。x轴代表特征的数量,y轴显示累计解释方差。
独立成分分析(ICA)
ICA是一种特征选择技术,可以帮助我们理解不同事物如何组合在一起。
想象一下,你有一个杂乱的声音盒子,里面有人们交谈的声音、音乐播放的声音、汽车鸣笛的声音。ICA将帮助我们分离这些声音,并通过分析每个声音独立地弄清楚它是什么。这有点像仔细听取嘈杂人群中的声音或乐器,以理解每个人或物在说或演奏什么。
以下是代码示例。看看执行ICA有多么容易吧!
>>> from sklearn.datasets import load_digits
>>> from sklearn.decomposition import FastICA
>>> X, _ = load_digits(return_X_y=True)
>>> transformer = FastICA(n_components=7,
...         random_state=0,
...         whiten='unit-variance')
>>> X_transformed = transformer.fit_transform(X)
>>> X_transformed.shape
(1797, 7)
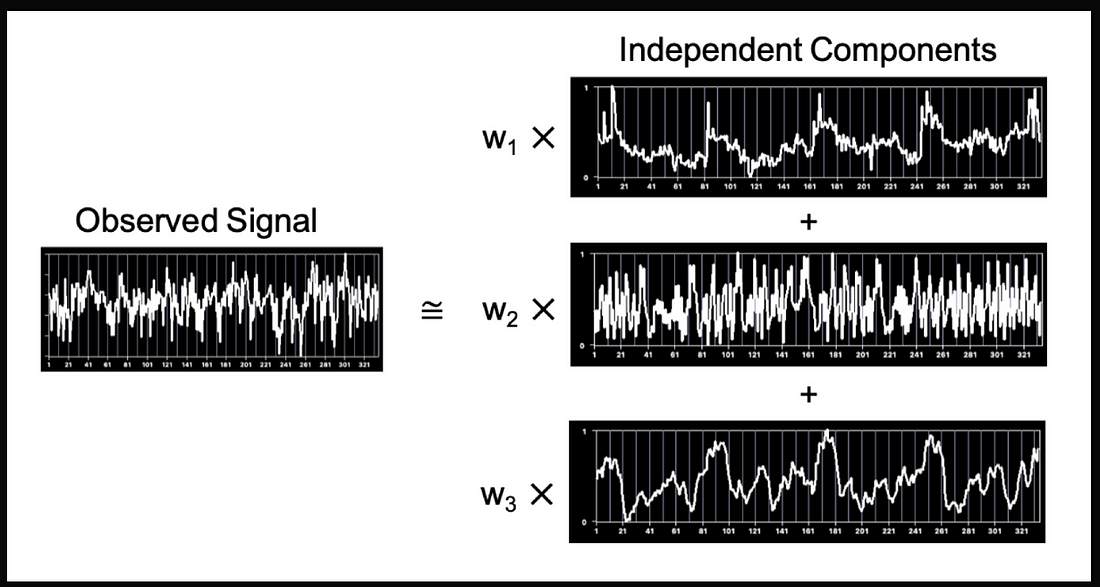
现在,这可能是输出的样子。
非负矩阵分解(NMF)
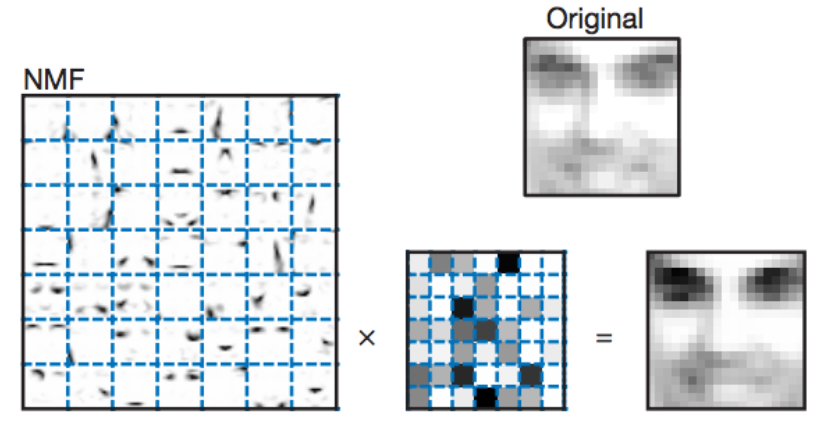
NMF 是一种能够将大数值分解成较小的正数的方法。
想象一下,你有一个表示整张图片的大数值,你想要了解这个图片由哪些部分组成。NMF 帮助我们找到较小的正数,当你将它们组合在一起时,可以重新创造出这个大数值或者图片。这就像拆解一个拼图,然后发现较小的碎片是如何组合在一起形成整个图片的。
以下是代码示例。和其他模型一样,这个函数也很容易实现。
>>> import numpy as np
>>> X = np.array([[1, 1], [2, 1], [3, 1.2], [4, 1], [5, 0.8], [6, 1]])
>>> from sklearn.decomposition import NMF
>>> model = NMF(n_components=2, init='random', random_state=0)
>>> W = model.fit_transform(X)
>>> H = model.components_
你可能会得到以下输出。
T分布随机领域嵌入(T-SNE)
T-SNE是一种机器学习技术,帮助我们理解事物之间的关联性。
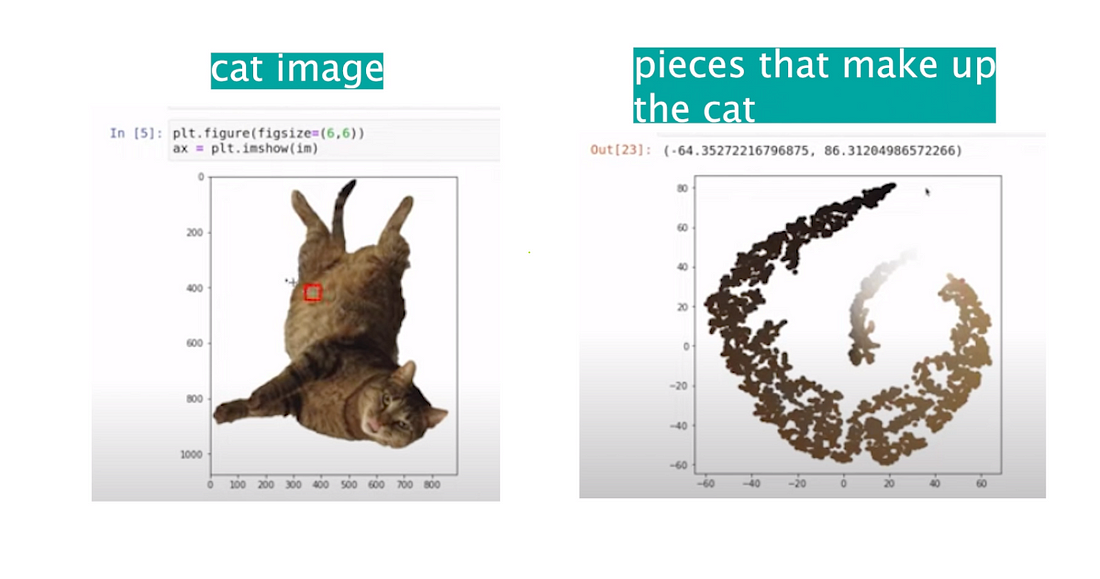
想象一下,你有很多动物的照片,你想看看哪些动物彼此相似。T-SNE可以帮助我们创建一个地图,把相似的动物放在一起。T-SNE帮助我们可视化和探索相似性。
下面是代码!再次强调,调用这个函数并实现模型非常简单。
>>> import numpy as np
>>> from sklearn.manifold import TSNE
>>> X = np.array([[0, 0, 0], [0, 1, 1], [1, 0, 1], [1, 1, 1]])
>>> X_embedded = TSNE(n_components=2, learning_rate='auto',
...                   init='random', perplexity=3).fit_transform(X)
>>> X_embedded.shape
(4, 2)
输出将会看起来像这样。
自动编码器
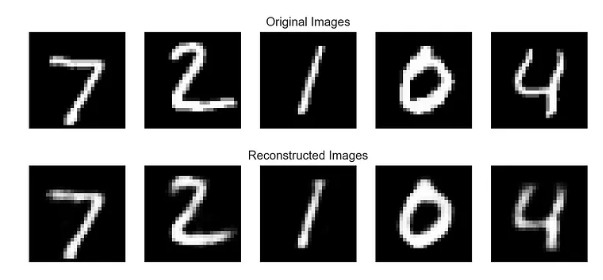
自动编码器是一种人工神经网络,它学习如何复制事物。
想象一下,你有一张动物的图画,你希望机器自己学习如何画出它。自动编码器通过给机器提供图画并要求生成一份副本来帮助机器学习。就像教机器如何模仿图画,这样它就会学会自己画动物。
自动编码器对于教机器理解和重新创建像画图或图像这样的事物非常有用。
下面是一个示例代码,展示了如何实现一个自动编码器。
input_size = 784
hidden_size = 128
code_size = 32
input_img = Input(shape=(input_size,))
hidden_1 = Dense(hidden_size, activation='relu')(input_img)
code = Dense(code_size, activation='relu')(hidden_1)
hidden_2 = Dense(hidden_size, activation='relu')(code)
output_img = Dense(input_size, activation='sigmoid')(hidden_2)
autoencoder = Model(input_img, output_img)
autoencoder.compile(optimizer= 'adam', loss='binary_crossentropy')
autoencoder.fit(x_train, x_train, epochsfs)
这是结果输出。
总结
特征选择是机器学习中一个至关重要的过程,涉及确定对模型准确性最有影响力的数据。
本文对监督和非监督特征选择技术的全面概述,包括基于过滤器、基于包装器和嵌入式方法。
所有这些技术都可以帮助避免过拟合和欠拟合,这是机器学习中最重要的两个挑战之一。


