教程:使用H3和Plotly构建六边形地图
通常情况下,当我们想要通过区域色彩地图来可视化一个变量时,我们会使用常见的行政几何图形。例如,如果我们想要看到整个欧洲的失业率,我们可以通过每个国家内的各个州来可视化它们。
然而,行政区域通常是不规则的,大小相互不同。因此,一种有用的可视化任何变量的替代方法是使用六边形来划分区域。其优点包括具有平衡的几何结构,以便更好地进行区域比较和改善领土覆盖范围。此外,六边形地图具有最小化视觉偏差的优势,因为它们提供了区域的均等代表,而传统的行政边界有时会因其不规则的形状和大小扭曲数据的感知。
在本文中,我们将逐步解释如何在Python中创建六边形地图。为此,我们将利用两个可以简化地图构建过程的库:H3和Plotly。
数据分析:巴塞罗那市酒店数据集
本文使用的数据集在巴塞罗那市的开放数据门户上可用。该开放数据门户提供了有关巴塞罗那市的人口、经济和社会学数据,所有数据都可以免费访问。
数据读取与清理
在下载文件之后,我们分析的第一步是进行数据读取和清理。在这种情况下,数据集包含许多与我们分析无关的列,我们不会对它们进行检查。我们将特别选择酒店的名称、地理位置(纬度和经度),以及可能与其位置相关的属性(虽然在这个特定案例中我们不会使用它们)。一旦我们选择了这些列,我们将用更简单的名称进行重命名,然后我们的数据集就准备好进行可视化了。
# Read the CSV file into a Pandas DataFrame
file_path = 'opendatabcn_allotjament_hotels-csv.csv'
df = pd.read_csv(file_path, encoding = 'utf-16')
# Define a list of column names to select
selected_column_names = ['name', 'addresses_neighborhood_name', 'addresses_district_name', 'geo_epgs_4326_x', 'geo_epgs_4326_y']
# Select the specified columns from the DataFrame
df = df[selected_column_names]
# Define a dictionary to map the old column names to the new names
column_name_mapping = {
    'name': 'Name',
    'addresses_neighborhood_name': 'Neighborhood',
    'addresses_district_name': 'District',
    'geo_epgs_4326_x': 'Latitude',
    'geo_epgs_4326_y': 'Longitude'
}
# Use the rename method to rename the columns
df.rename(columns=column_name_mapping, inplace=True)
# Extract the name of the hotel
df['Name'] = df['Name'].str.split(' - ').str[0]
# Display the first few rows of the DataFrame
df.head()

使用H3生成六边形网络
为了在地图上可视化数据,我们的第一步是创建网格。为了实现这一目标,我们将使用由Uber开发的H3库。get_hexagon_grid函数负责创建以GeoDataFrame形式呈现的六边形网格。它首先在特定位置(纬度和经度)创建一个六边形,这里是巴塞罗那的中心。这个六边形的大小由resolution参数定义。随后,以同样大小的六边形以同心圆的方式生成在中心六边形周围。创建同心圆的数量由ring_size参数确定。最后,将这些六边形集合转换为GeoDataFrame,其中每个六边形被分配一个与H3库提供的ID相对应的唯一ID。
def get_hexagon_grid(latitude, longitude, resolution, ring_size):
    """
    Generate a hexagonal grid GeoDataFrame centered around a specified location.
    Parameters:
    - latitude (float): Latitude of the center point.
    - longitude (float): Longitude of the center point.
    - resolution (int): H3 resolution for hexagons.
    - ring_size (int): Number of rings to create around the center hexagon.
    Returns:
    - hexagon_df (geopandas.GeoDataFrame): GeoDataFrame containing hexagons and their geometries.
    """
    # Get the H3 hexagons covering the specified location
    center_h3 = h3.geo_to_h3(latitude, longitude, resolution)
    hexagons = list(h3.k_ring(center_h3, ring_size))  # Convert the set to a list
    # Create a GeoDataFrame with hexagons and their corresponding geometries
    hexagon_geometries = [shapely.geometry.Polygon(h3.h3_to_geo_boundary(hexagon, geo_json=True)) for hexagon in hexagons]
    hexagon_df = gpd.GeoDataFrame({'Hexagon_ID': hexagons, 'geometry': hexagon_geometries})
    return hexagon_df
下图说明了参数如何resolution影响ring_size创建的网格。Resolution控制六边形的大小,这意味着更高的分辨率会导致更小的六边形。另一方面,该ring_size参数控制围绕中心六边形创建的六边形同心环的数量。换句话说,越大,ring_size同心环的数量就越多。在下图中,所有图都具有相同的轴限制。正如你所观察到的,为了覆盖相同的区域,使用更高分辨率需要更多的环,因为如前所述,创建的所有六边形的大小与中心六边形相同。
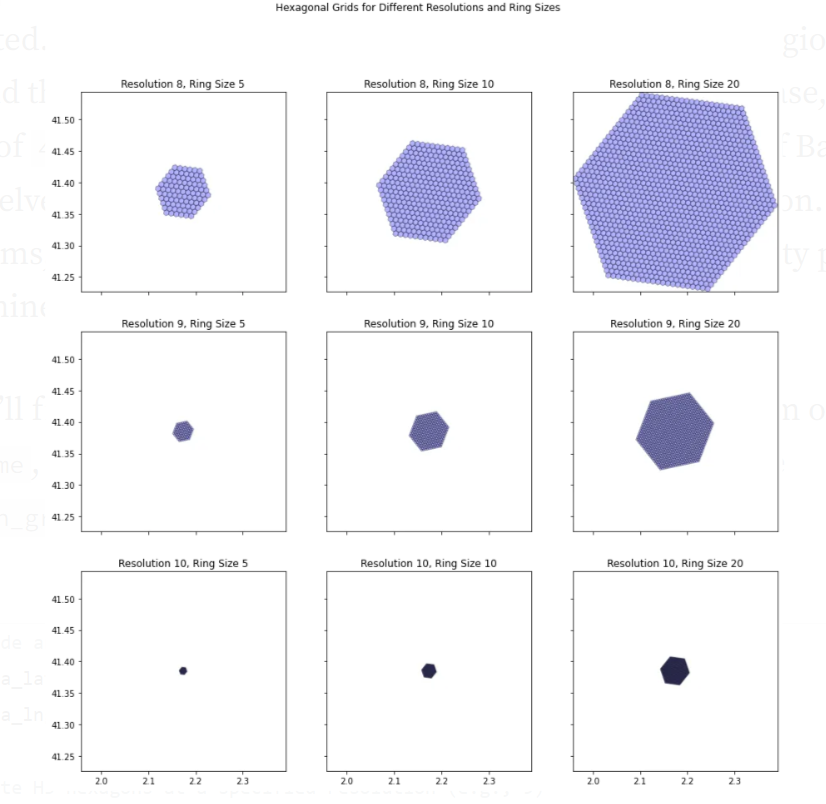
选择resolution将取决于我们想要在特定区域中表示的变量的变化。如果存在显着差异,resolution将考虑更高的值。9在本例中,已选择分辨率。此外,这ring_size将取决于我们目标覆盖的区域和resolution之前选择的区域。在这种特定情况下,aring_size足以45覆盖巴塞罗那市的整个区域。我们不会深入研究如何得出这个结论的细节。一般来说,我们获得了巴塞罗那城市多边形的边界框,并确定了覆盖该区域所需的环数。
GeoDataFrame下面,你将看到使用前面描述的参数和函数以 a 的形式创建六边形网络get_hexagon_grid。
# Latitude and longitude coordinates for the center of Barcelona
barcelona_lat = 41.3851
barcelona_lng = 2.1734
# Generate H3 hexagons at a specified resolution (e.g., 9)
resolution = 9
# Indicate the number of rings around the central hexagon
ring_size = 45
# Hexagon grid around barcelona
hexagon_df = get_hexagon_grid(barcelona_lat, barcelona_lng, resolution, ring_size)
# Visualize the first rows of the GeoDataFrame
hexagon_df.head()
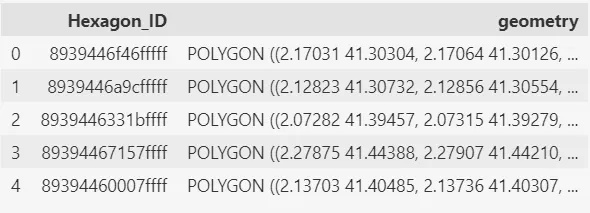
如上所述,get_hexagon_grid函数提供一个GeoDataFrame,其中包含两列:第一列用于由H3库分配给每个多边形的唯一ID,而第二列包含实际的多边形,命名为geometry。
将每个酒店分配到其对应的六边形中
创建六边形网格后,需要将每个酒店分配到它所属的六边形中。calculate_hexagon_ids函数计算每个酒店所属的六边形,并创建一个名为Hexagon_ID的新列来存储这些信息。
def calculate_hexagon_ids(df, hexagon_df):
    """
    Calculate Hexagon IDs for each hotel in a DataFrame based on their geographic coordinates.
    Args:
        df (pd.DataFrame): DataFrame containing hotel data with "Latitude" and "Longitude" columns.
        hexagon_df (gpd.GeoDataFrame): GeoDataFrame with hexagon geometries and associated Hexagon IDs.
    Returns:
        pd.DataFrame: The input DataFrame with an additional "Hexagon_ID" column indicating the Hexagon ID for each hotel.
    """
    # Create a column Hexagon_ID with the ID of the hexagon
    df['Hexagon_ID'] = None
    # Iterate through the hotels in the df DataFrame and calculate hotel counts within each hexagon
    for i, hotel in df.iterrows():
        point = shapely.geometry.Point(hotel["Longitude"], hotel["Latitude"])  # Latitude and Longitude switched
        for _, row in hexagon_df.iterrows():
            if point.within(row['geometry']):
                df.loc[i, 'Hexagon_ID'] = row['Hexagon_ID']

    return df
# Use the function to calculate the hexagon_ids
df = calculate_hexagon_ids(df, hexagon_df)
# Visualize the first rows of the DataFrame
df.head()

现在,所有酒店的数据集也包括关于每个酒店所在六边形的信息。这些信息在Hexagon_ID列中以字母数字标识符的形式提供。
根据要可视化的变量对数据进行分组
一旦确定了六边形的ID,我们就可以计算我们想要可视化的数据。在这种特殊情况下,我们的目标是显示每个六边形中的酒店数量。为了实现这一目标,我们进行了按Hexagon_ID分组和count操作。此外,我们还希望实现一个悬停功能,允许我们查看每个六边形中的酒店名称。为了实现这一目标,在分组中我们进行了所有酒店名称的连接操作。我们使用HTML的<br>标签来表示连接中的换行,因为Plotly使用HTML来定义其悬停文本。
# Group by Hexagon_ID and perform the operations
grouped_df = df.groupby('Hexagon_ID').agg({
    'Name': ['count', '<br>'.join]
}).reset_index()
# Rename columns for clarity
grouped_df.columns = ['Hexagon_ID', 'Count', 'Hotels']
# Visualize the first rows of the DataFrame
grouped_df.head()

如上所示,分组的数据框有三列:(1) Hexagon_ID,其中包含唯一的六边形标识符,(2) Count,表示该六边形中的酒店数量,和 (3) Hotels,包含该六边形内的酒店名称列表。
数据可视化: 使用六边形的地图视图来表示巴塞罗那的酒店
一旦数据被分组,我们可以进行最后一步,即使用Plotly来创建六边形地图。
create_choropleth_map函数负责处理分组数据集和包含每个六边形几何图形的数据集,生成六边形地图。这个地图可以让我们可视化城市哪些区域有更高的酒店密度。
def create_choropleth_map(geojson_df, data_df, alpha=0.4, map_style="carto-positron", color_scale="Viridis"):
    """
    Create an interactive choropleth map using Plotly Express.
    Parameters:
    - geojson_df (GeoDataFrame): GeoJSON data containing polygon geometries.
    - data_df (DataFrame): DataFrame containing data to be visualized on the map.
    - alpha (float): Opacity level for the map polygons (0.0 to 1.0).
    - map_style (str): Map style for the Plotly map (e.g., "carto-positron").
    - color_scale (str): Color scale for the choropleth map.
    Returns:
    None
    """
    # Merge the GeoJSON data with your DataFrame
    merged_df = geojson_df.merge(data_df, on="Hexagon_ID", how="left")
    # Create a choropleth map using px.choropleth_mapbox
    fig = px.choropleth_mapbox(
        merged_df,
        geojson=merged_df.geometry,
        locations=merged_df.index,  # Use index as locations to avoid duplicate rows
        color="Count",
        color_continuous_scale=color_scale,
        title="Hotel Distribution Heatmap in Barcelona City",
        mapbox_style=map_style,
        center={"lat": 41.395, "lon": 2.18},  # Adjust the center as needed
        zoom=11.5,
    )
    # Customize the opacity of the hexagons
    fig.update_traces(marker=dict(opacity=alpha))
    # Add hover data for hotel names
    fig.update_traces(customdata=merged_df["Hotels"])
    # Define the hover template
    hover_template = "<b>Hotels:</b> %{customdata}<extra></extra>"
    fig.update_traces(hovertemplate=hover_template)
    # Set margins to 25 on all sides
    fig.update_layout(margin=dict(l=35, r=35, t=45, b=35))

    # Adjust the width of the visualization
    fig.update_layout(width=1000)
    fig.show()
# Call the function with your GeoJSON and DataFrame
create_choropleth_map(geojson_df=hexagon_df, data_df=grouped_df)
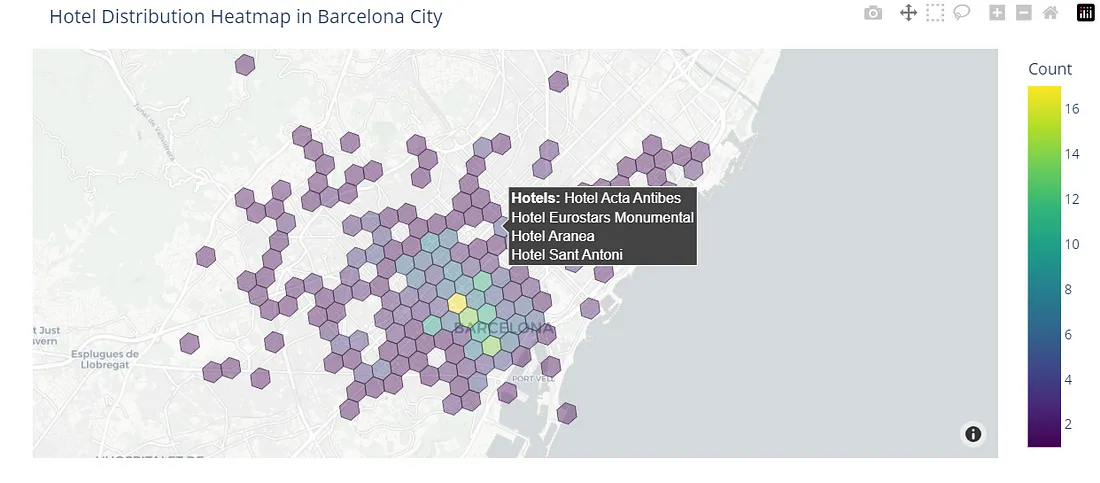
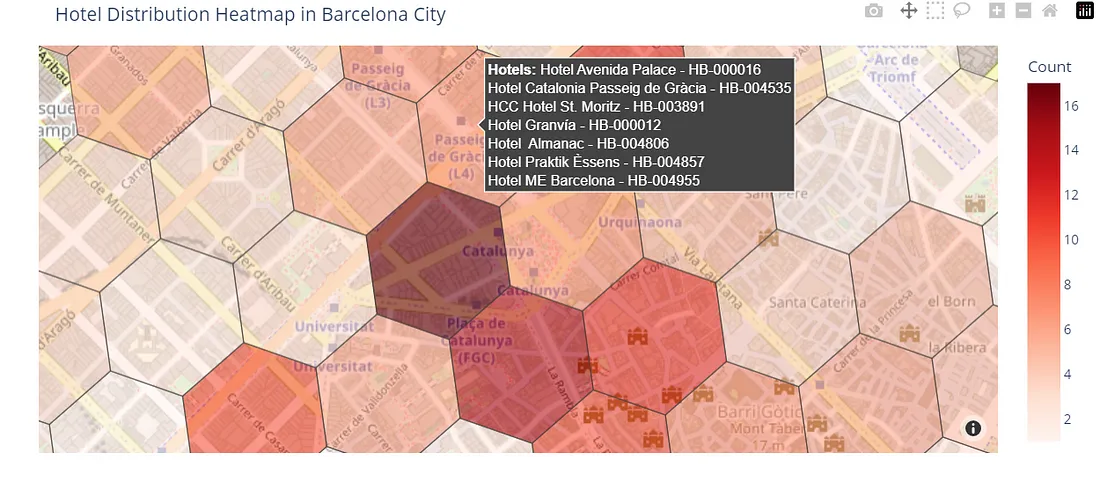
为了创建地图,我们将使用Plotly Express中提供的choropleth_mapbox函数。该函数生成一个地图,根据每个六边形中检测到的酒店数量对其进行着色,使用用户选择的连续色谱。当你将鼠标悬停在其中一个六边形上时,你可以查看该六边形内的酒店列表。
在本例中,使用的背景地图是carto-positron,但可以轻松调整该参数以使用不同的地图样式,以便更好地识别城市街道和兴趣点,如开放街道地图。此外,我们还可以使用不同的颜色比例尺。在之前的案例中,我们使用Viridis颜色比例尺,而在这个案例中,我们使用Reds颜色比例尺。
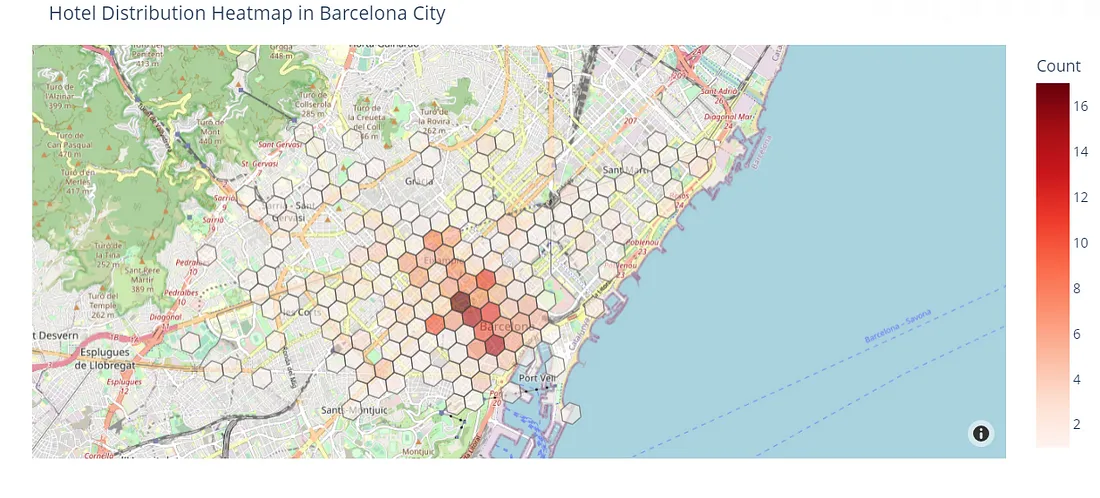
地图是交互式的,我们可以对感兴趣的地区进行缩放。
当我们放大呈红色调的地区时,可以看到巴塞罗那大多数的酒店都位于加泰罗尼亚广场附近。
总结
有行政区划的分级填色地图是可视化地理区域内变量分布的有价值的方式。然而,由于行政区划的形状和大小不规则,它们在提供变量分布的可视化时存在偏差。因此,使用具有规则几何形状的六边形地图作为分析领域内分布的高度有用的替代方法。在本文中,我们详细解释了如何使用Uber H3库创建六边形网格,并且展示了如何利用该网格在Plotly可视化中呈现巴塞罗那的酒店分布情况。


