7个用于快速数据可视化的Pandas绘图函数
当你使用pandas分析数据时,你会使用pandas函数进行过滤和转换列,合并来自多个数据框的数据等操作。
但通常生成图表来可视化数据框中的数据,而不仅仅是查看数字,会更有帮助。
Pandas有几个你可以用来进行快速简便数据可视化的绘图函数。我们将在本教程中逐一讲解它们。
创建Pandas DataFrame
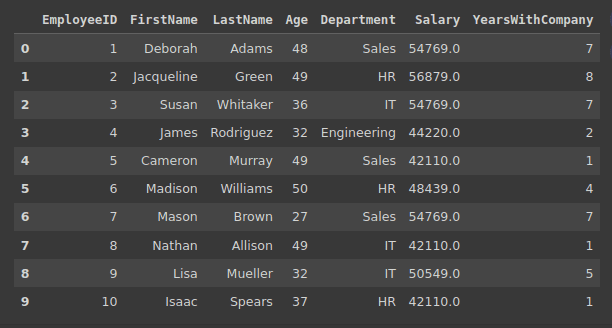
让我们创建一个用于分析的样本数据框。我们将创建一个名为包含员工记录的数据框。df_employees
我们将使用Faker和NumPy的random模块来用200条记录填充数据框。
注意:如果你的开发环境中没有安装Faker,你可以使用pip来安装:pip install Faker。
运行以下代码片段来创建df_employees并用记录填充:df_employees
import pandas as pd

from faker import Faker

import numpy as np


# Instantiate Faker object

fake = Faker()

Faker.seed(27)


# Create a DataFrame for employees

num_employees = 200

departments = ['Engineering', 'Finance', 'HR', 'Marketing', 'Sales', 'IT']


years_with_company = np.random.randint(1, 10, size=num_employees)

salary = 40000 + 2000 * years_with_company * np.random.randn()


employee_data = {

 'EmployeeID': np.arange(1, num_employees + 1),

 'FirstName': [fake.first_name() for _ in range(num_employees)],

 'LastName': [fake.last_name() for _ in range(num_employees)],

 'Age': np.random.randint(22, 60, size=num_employees),

 'Department': [fake.random_element(departments) for _ in range(num_employees)],

 'Salary': np.round(salary),

 'YearsWithCompany': years_with_company

}


df_employees = pd.DataFrame(employee_data)


# Display the head of the DataFrame

df_employees.head(10)
我们已经为可重复性埋下了种子。因此,每次运行此代码时,都会获得相同的记录。
以下是数据帧的第一个视图记录:
1.散点图
散点图通常用于了解数据集中任意两个变量之间的关系。
对于数据帧,让我们创建一个散点图来可视化员工年龄与工资之间的关系。这将有助于我们了解员工的年龄与其工资之间是否存在任何相关性。df_employees
要创建散点图,我们可以这样使用:plot.scatter()
# Scatter Plot: Age vs Salary

df_employees.plot.scatter(x='Age', y='Salary', title='Scatter Plot: Age vs Salary', xlabel='Age', ylabel='Salary', grid=True)
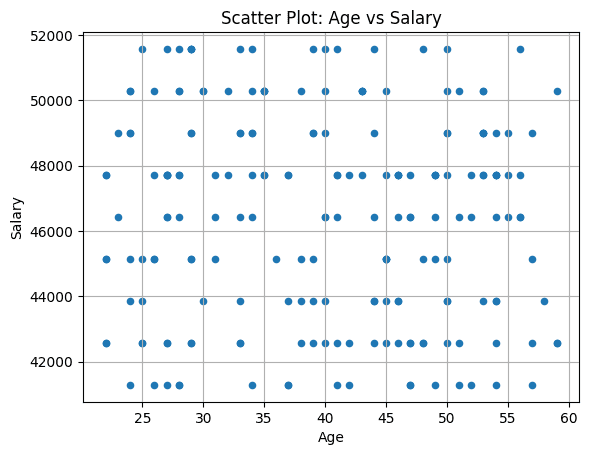
对于此示例数据帧,我们没有看到员工年龄与工资之间存在任何相关性。
2.折线图
折线图适用于识别连续变量(通常是时间或类似尺度)的趋势和模式。
在创建数据帧时,我们定义了员工在公司工作的年数与其工资之间的线性关系。因此,让我们看一下显示平均工资如何随年数变化的折线图。df_employees
我们找到按公司年份分组的平均工资,然后创建一个线图:plot.line()
# Line Plot: Average Salary Trend Over Years of Experience
average_salary_by_experience = df_employees.groupby('YearsWithCompany')['Salary'].mean()
df_employees['AverageSalaryByExperience'] = df_employees['YearsWithCompany'].map(average_salary_by_experience)
df_employees.plot.line(x='YearsWithCompany', y='AverageSalaryByExperience', marker='o', linestyle='-', title='Average Salary Trend Over Years of Experience', xlabel='Years With Company', ylabel='Average Salary', legend=False, grid=True)
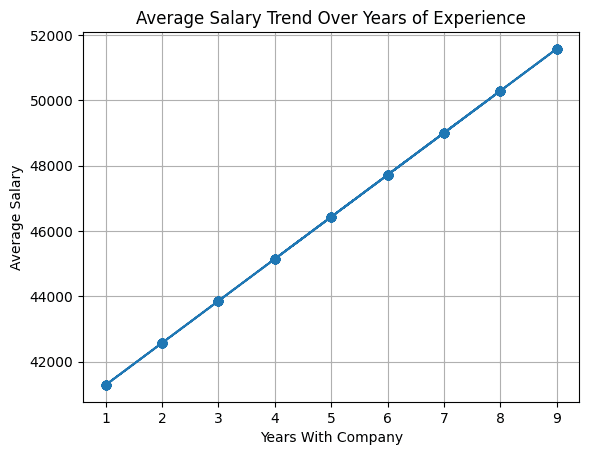
由于我们选择使用与员工在公司工作的年数的线性关系来填充工资字段,因此我们看到折线图反映了这一点。
3.柱状图
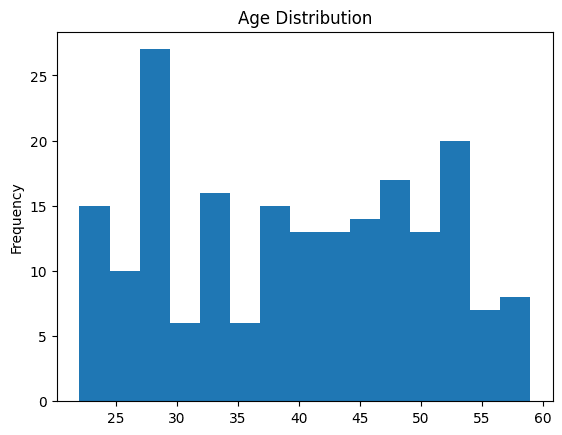
你可以使用柱状图来可视化连续变量的分布(通过将值划分为区间或条柱),并显示每个条柱中的数据点数。
让我们使用直方图了解员工年龄的分布,如下所示:plot.hist()
# Histogram: Distribution of Ages
df_employees['Age'].plot.hist(title='Age Distribution', bins=15)
4.方框图
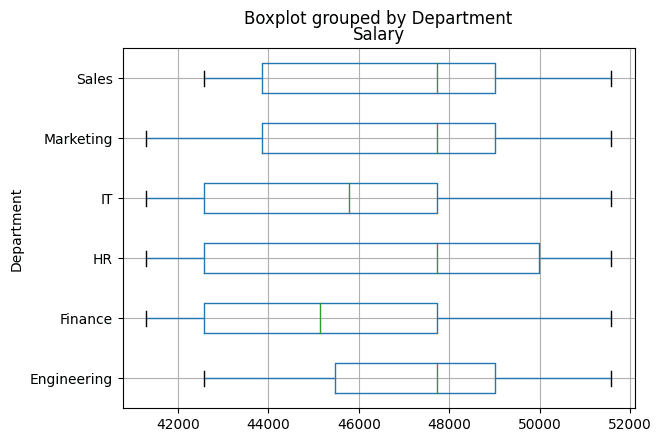
方框图有助于理解变量的分布、分布以及识别异常值。
让我们创建一个方框图来比较不同部门的薪酬分布——对组织内的薪酬分布进行高级比较。
方框图还将有助于确定工资范围以及有用的信息,如每个部门的工资中位数和潜在的异常值。
在这里,我们使用按“部门”分组的“工资”列:方框图
# Box Plot: Salary distribution by Department

df_employees.boxplot(column='Salary', by='Department', grid=True, vert=False)
5.条形图
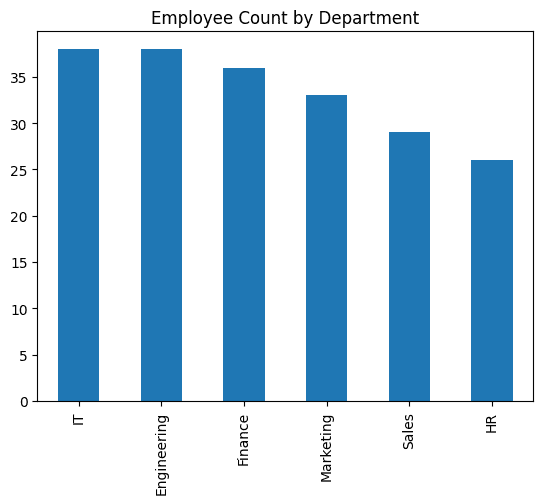
当你想要了解变量在发生频率方面的分布时,可以使用条形图。
现在,让我们创建一个条形图,用于可视化员工人数:plot.bar()
# Bar Plot: Department-wise employee count
df_employees['Department'].value_counts().plot.bar(title='Employee Count by Department')
6.面积图
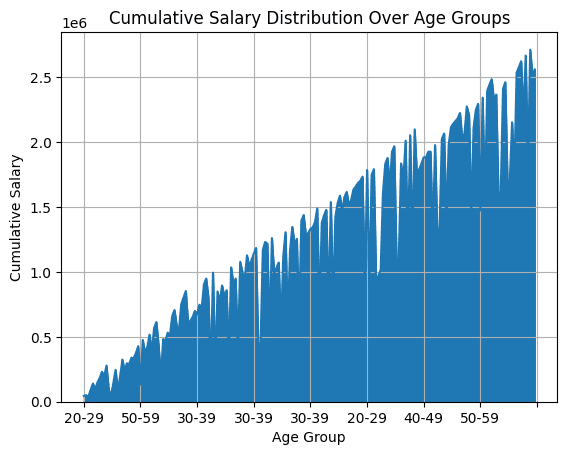
面积图通常用于可视化变量在连续轴或分类轴上的累积分布。
对于员工数据帧,我们可以绘制不同年龄组的累积工资分布。为了根据年龄组将员工映射到箱中,我们使用 .pd.cut()
然后,我们按“年龄组”找到工资组的累计总和。为了得到面积图,我们使用:plot.area()
# Area Plot: Cumulative Salary Distribution Over Age Groups

df_employees['AgeGroup'] = pd.cut(df_employees['Age'], bins=[20, 30, 40, 50, 60], labels=['20-29', '30-39', '40-49', '50-59'])

cumulative_salary_by_age_group = df_employees.groupby('AgeGroup')['Salary'].cumsum()


df_employees['CumulativeSalaryByAgeGroup'] = cumulative_salary_by_age_group


df_employees.plot.area(x='AgeGroup', y='CumulativeSalaryByAgeGroup', title='Cumulative Salary Distribution Over Age Groups', xlabel='Age Group', ylabel='Cumulative Salary', legend=False, grid=True)
7.饼状图
当你想要可视化整体中每个类别的比例时,饼状图非常有用。
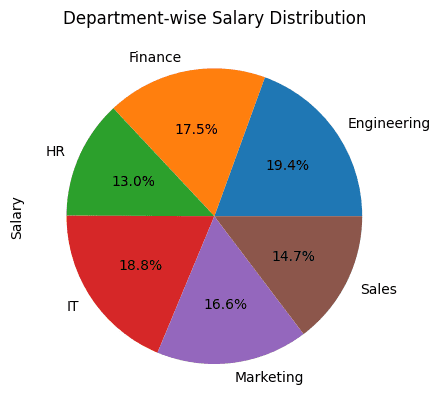
对于我们的示例,创建一个饼状图来显示组织内各部门的工资分布是有意义的。
我们找到按部门分组的员工总工资。然后用来绘制饼状图:plot.pie()
# Pie Chart: Department-wise Salary distribution
df_employees.groupby('Department')['Salary'].sum().plot.pie(title='Department-wise Salary Distribution', autopct='%1.1f%%')
