如何估计单个图像的深度
人类用两只眼睛看世界。这种双目视觉的主要优势之一是感知深度的能力——物体的远近。人类大脑通过比较左右眼同时拍摄的图片并解释差异来推断物体深度。这个过程被称为立体视觉。
正如深度感知在人类视觉和导航中起着至关重要的作用一样,估计深度的能力对于广泛的计算机视觉应用也至关重要,从自动驾驶到机器人,甚至是增强现实。然而,从空间限制到预算约束的一系列实际考虑因素往往将这些应用限制在单个相机上。
单目深度估计(MDE)是从单幅图像预测场景深度的任务。来自单个图像的深度计算本质上是不明确的,因为有多种方式将相同的3D场景投影到图像的2D平面上。因此,MDE是一项具有挑战性的任务,需要(显式或隐式)考虑许多线索,如对象大小、遮挡和视角。
在本文中,我们将说明如何加载和可视化深度图数据,运行单目深度估计模型,并评估深度预测。我们将使用来自Sun RGB-D数据集的数据来执行此操作。
我们将使用Hugging Face Transformer和Diffusers库进行推理,使用FiftyOne进行数据管理和可视化,使用Scikit-Image进行评估度量。所有这些库都是开源的,可以免费使用。
在我们开始之前,请确保你已安装了所有必要的库:
pip install -U torch fiftyone diffusers transformers scikit-image
然后,我们将导入我们将在整个帖子中使用的模块:
from glob import glob
import numpy as np
from PIL import Image
import torch
import fiftyone as fo
import fiftyone.zoo as foz
import fiftyone.brain as fob
from fiftyone import ViewField as F
加载和可视化Sun-RGBD深度数据
Sun RGB-D数据集包含10,335个RGB-D图像,每个图像都有相应的RGB图像、深度图像和相机内部特性。它包含来自NYU Depth V2、Berkeley B3DO和Sun3D数据集的图像。Sun RGB-D是用于单目深度估计和语义分割任务的最流行的数据集之一。
在本文中,我们将仅使用NYU Depth V2部分。
下载原始数据
首先,从这里下载Sun RGB-D数据集并将其解压缩,或者使用以下命令直接下载:
curl -o sunrgbd.zip https://rgbd.cs.princeton.edu/data/SUNRGBD.zip
然后解压缩它:
unzip sunrgbd.zip
创建数据集
因为我们只对这一点感兴趣,所以我们将把自己限制在前20个样本上,这些样本都来自数据集的NYU Depth v2 部分:
## create, name, and persist the dataset
dataset = fo.Dataset(name="SUNRGBD-20", persistent=True)
## pick out first 20 scenes
scene_dirs = glob("SUNRGBD/kv1/NYUdata/*")[:20]
samples = []
for scene_dir in scene_dirs:
    ## Get image file path from scene directory
    image_path = glob(f"{scene_dir}/image/*")[0]
    ## Get depth map file path from scene directory
    depth_path = glob(f"{scene_dir}/depth_bfx/*")[0]
    depth_map = np.array(Image.open(depth_path))
    depth_map = (depth_map * 255 / np.max(depth_map)).astype("uint8")
    ## Create sample
    sample = fo.Sample(
        filepath=image_path,
        gt_depth=fo.Heatmap(map=depth_map),
    )

    samples.append(sample)
## Add samples to dataset
dataset.add_samples(samples);
在这里,我们将深度图存储为热图。所有内容都以规格化的相对距离表示,其中255表示场景中的最大距离,0表示场景中的最小距离。这是表示深度图的常用方法,尽管它远不是唯一的方法。如果我们对绝对距离感兴趣,我们可以存储场景中最小和最大距离的采样参数,并使用这些参数从相对距离重建绝对距离。
可视化地面实况数据
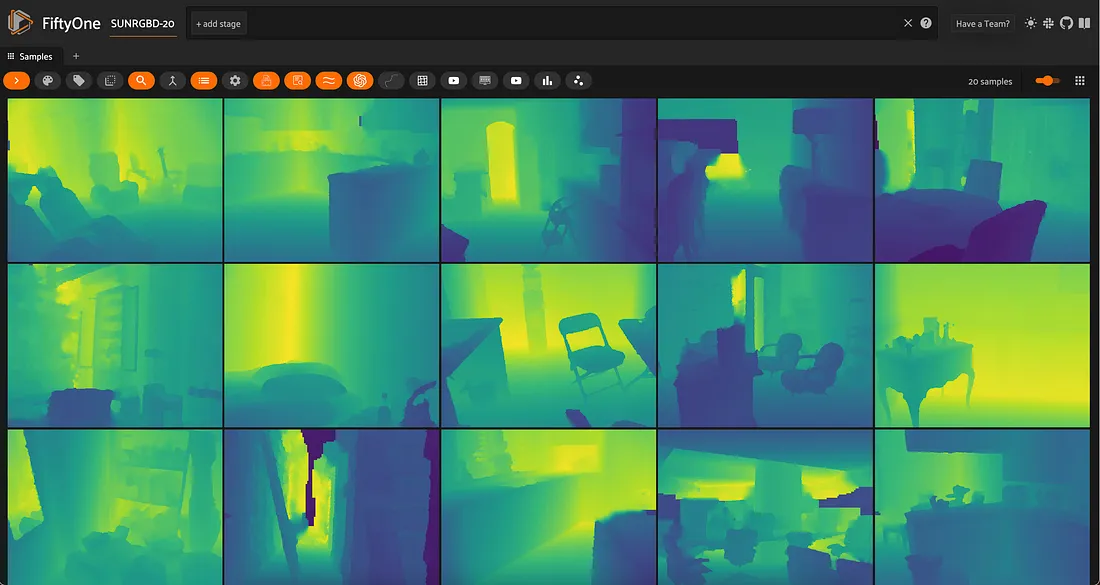
通过存储在样本上的热图,我们可以可视化地面实况数据:
session = fo.launch_app(dataset, auto=False)
## then open tab to localhost:5151 in browser
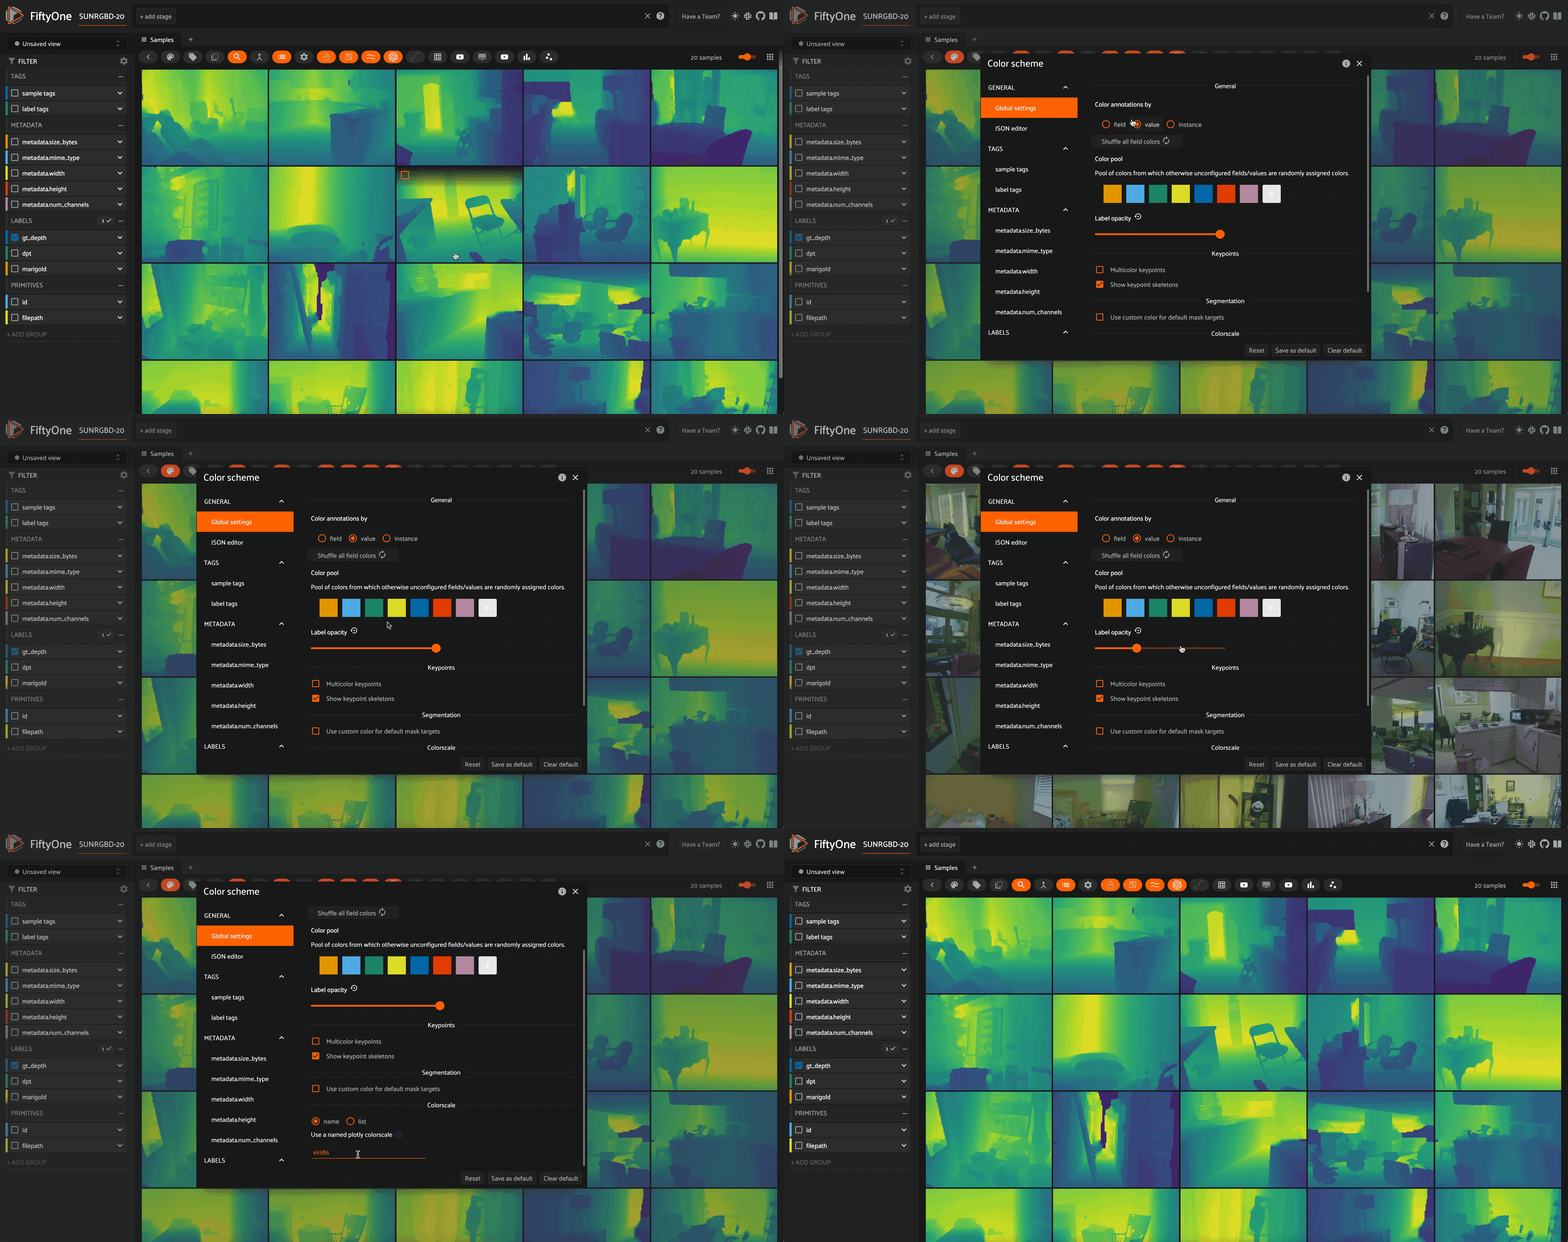
使用深度贴图时,热图的配色方案和不透明度非常重要。
地面实况?
检查这些RGB图像和深度图,我们可以看到在地面实况深度图中存在一些不准确的地方。例如,在此图像中,穿过图像中心的黑暗裂缝实际上是场景的最远部分,但地面实况深度图将其显示为场景的最近部分:
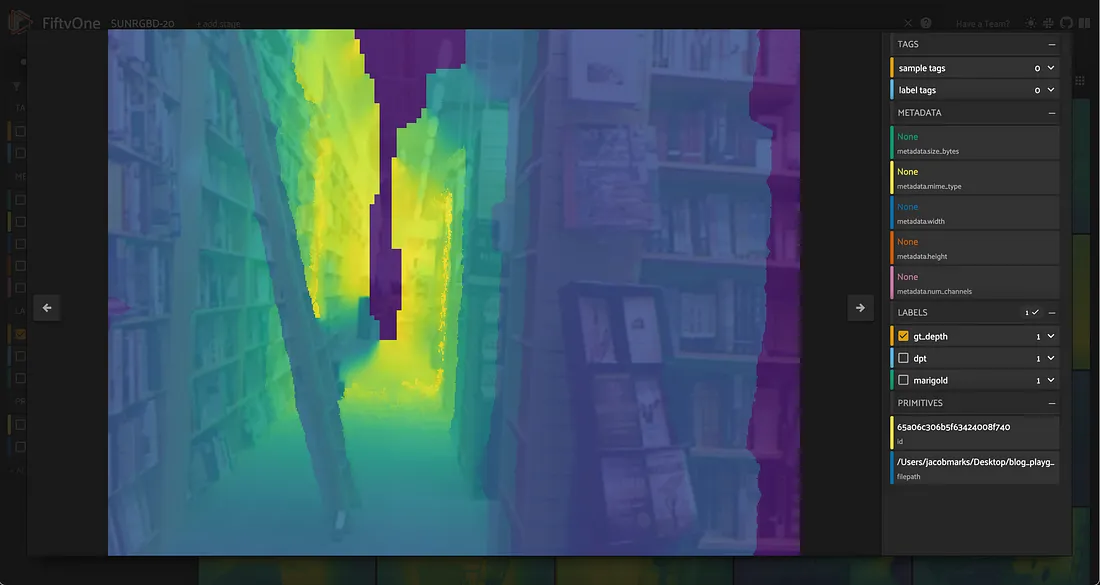
这是MDE任务的关键挑战之一:地面实况数据很难获得,而且经常是嘈杂的。在评估你的MDE模型时,必须意识到这一点。
运行单目深度估计模型
现在我们已经加载了数据集,我们可以在RGB图像上运行单目深度估计模型。
长期以来,最先进的单目深度估计模型,如Dorn和DenseDepth,都是用卷积神经网络建立的。然而,最近,无论是基于变压器的模型,如DPT和GLPN,还是基于扩散的模型,如Marigold,都取得了显著的成果。
在本节中,我们将向你展示如何使用DPT和Marigold生成MDE深度图预测。在这两种情况下,你都可以选择使用各自的拥抱面库在本地运行模型,或者使用Replicate远程运行模型。
要通过REPLICATE运行,请安装Python客户端:
pip install replicate
并导出复制API令牌:
export REPLICATE_API_TOKEN=r8_<your_token_here>
对于复制,模型可能需要一分钟才能加载到服务器上的内存中(冷启动问题),但一旦加载到服务器上的内存中,预测应该只需要几秒钟。根据你的本地计算资源,与本地运行相比,在服务器上运行可能会给你带来巨大的加速,特别是对于Marigold和其他基于扩散的深度估计方法。
基于DPT的单目深度估计
我们将运行的第一个模型是密集预测转换器(DPT)。DPT模型在MDE和语义分割(需要“密集”的像素级预测的任务)中都很有用。
下面的检查点使用Midas,它返回反向深度图,因此我们必须将其反向以获得可比较的深度图。
要使用Transformer在本地运行,首先要加载模型和图像处理器:
from transformers import AutoImageProcessor, AutoModelForDepthEstimation
## swap for "Intel/dpt-large" if you'd like
pretrained = "Intel/dpt-hybrid-midas"
image_processor = AutoImageProcessor.from_pretrained(pretrained)
dpt_model = AutoModelForDepthEstimation.from_pretrained(pretrained)
接下来,我们封装用于对样本进行推断的代码,包括前处理和后处理:
def apply_dpt_model(sample, model, label_field):
    image = Image.open(sample.filepath)
    inputs = image_processor(images=image, return_tensors="pt")
    with torch.no_grad():
        outputs = model(**inputs)
        predicted_depth = outputs.predicted_depth
    prediction = torch.nn.functional.interpolate(
        predicted_depth.unsqueeze(1),
        size=image.size[::-1],
        mode="bicubic",
        align_corners=False,
    )
    output = prediction.squeeze().cpu().numpy()
    ## flip b/c MiDaS returns inverse depth
    formatted = (255 - output * 255 / np.max(output)).astype("uint8")
    sample[label_field] = fo.Heatmap(map=formatted)
    sample.save()
在这里,我们将预测存储在样本上的label_field中,用热图表示,就像地面实况标签一样。
请注意,在应用_DPT_model()函数中,在模型的向前传递和热图生成之间,请注意我们调用了torch.NN.functional.interpolate()。这是因为模型的正向传递是在图像的下采样版本上运行的,并且我们希望返回与原始图像大小相同的热图。
但是,如果我们想要在每个像素的基础上将地面实况深度图与模型的预测进行比较,我们需要确保它们的大小相同。
剩下要做的就是遍历数据集:
for sample in dataset.iter_samples(autosave=True, progress=True):
    apply_dpt_model(sample, dpt_model, "dpt")
session = fo.launch_app(dataset)
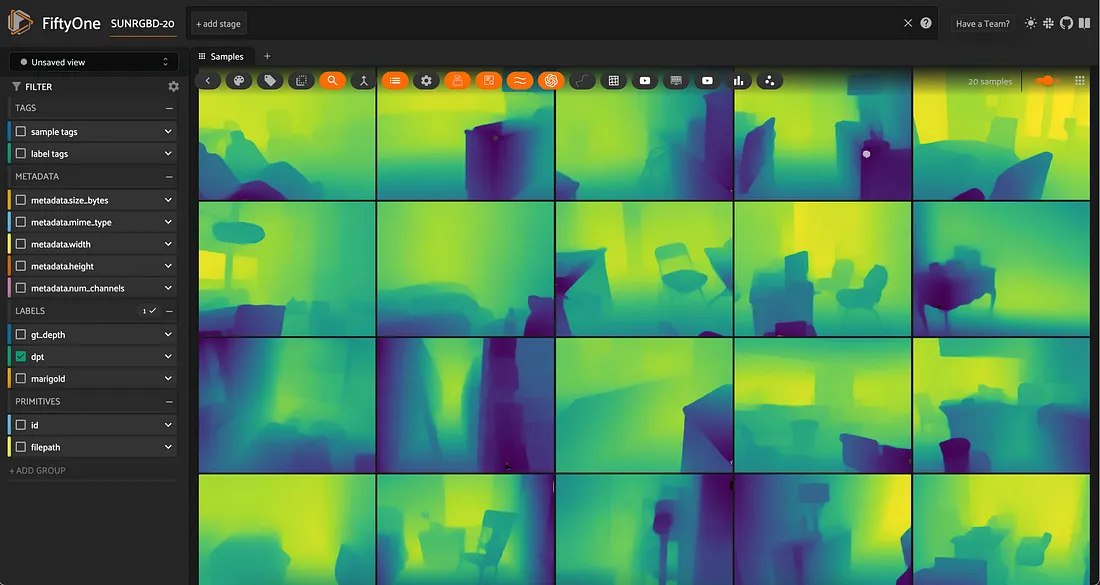
要运行REPLICATE,可以使用此模型。下面是API的外观:
import replicate
## example application to first sample
rgb_fp = dataset.first().filepath
output = replicate.run(
    "cjwbw/midas:a6ba5798f04f80d3b314de0f0a62277f21ab3503c60c84d4817de83c5edfdae0",
    input={
        "model_type": "dpt_beit_large_512",
        "image":open(rgb_fp, "rb")
    }
)
print(output)
使用 Marigold 进行单目深度估计
由于其在文本到图像环境中的巨大成功,扩散模型正被应用于不断扩大的问题范围。用于单目深度估计的金盏花“再利用”基于扩散的图像生成模型。
要在本地运行Marigold,你需要克隆Git存储库:
git clone https://github.com/prs-eth/Marigold.git
此存储库引入了一个新的扩散器管道MarigoldPipeline,它使应用Marigold变得简单:
## load model
from Marigold.marigold import MarigoldPipeline
pipe = MarigoldPipeline.from_pretrained("Bingxin/Marigold")
## apply to first sample, as example
rgb_image = Image.open(dataset.first().filepath)
output = pipe(rgb_image)
depth_image = output['depth_colored']
然后,需要对输出深度图像进行后处理。
要改为通过Replicate 运行,我们可以创建一个Apply_Marigold_model()函数,与上面的DPT案例类似,并对中的样本进行迭代我们的数据集:
import replicate
import requests
import io
def marigold_model(rgb_image):
    output = replicate.run(
        "adirik/marigold:1a363593bc4882684fc58042d19db5e13a810e44e02f8d4c32afd1eb30464818",
        input={
            "image":rgb_image
        }
    )
    ## get the black and white depth map
    response = requests.get(output[1]).content
    return response
def apply_marigold_model(sample, model, label_field):
    rgb_image = open(sample.filepath, "rb")
    response = model(rgb_image)
    depth_image = np.array(Image.open(io.BytesIO(response)))[:, :, 0] ## all channels are the same
    formatted = (255 - depth_image).astype("uint8")
    sample[label_field] = fo.Heatmap(map=formatted)
    sample.save()
for sample in dataset.iter_samples(autosave=True, progress=True):
    apply_marigold_model(sample, marigold_model, "marigold")
session = fo.launch_app(dataset)
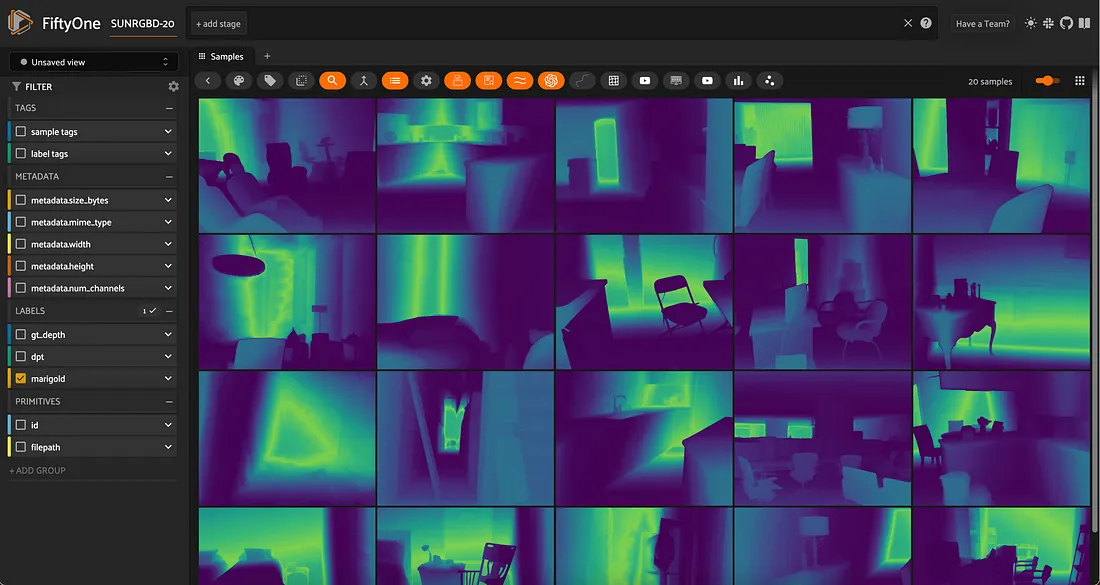
评估单目深度估计模型
现在我们有了多个模型的预测,让我们对它们进行评估。我们将利用Scikit-Image来应用通常用于单目深度估计的三个简单度量:均方根误差(RMSE)、峰值信噪比(PSNR)和结构相似性指数(SSIM)。
较高的PSNR和SSIM分数表示较好的预测,而较低的RMSE分数表示较好的预测。
请注意,我得到的特定值是我在此过程中执行的特定前后处理步骤的结果。重要的是相对性能。
我们将定义评估程序:
from skimage.metrics import peak_signal_noise_ratio, mean_squared_error, structural_similarity
def rmse(gt, pred):
    """Compute root mean squared error between ground truth and prediction"""
    return np.sqrt(mean_squared_error(gt, pred))
def evaluate_depth(dataset, prediction_field, gt_field):
  """Run 3 evaluation metrics for all samples for `prediction_field`
     with respect to `gt_field`"""
    for sample in dataset.iter_samples(autosave=True, progress=True):
        gt_map = sample[gt_field].map
        pred = sample[prediction_field]
        pred_map = pred.map
        pred["rmse"] = rmse(gt_map, pred_map)
        pred["psnr"] = peak_signal_noise_ratio(gt_map, pred_map)
        pred["ssim"] = structural_similarity(gt_map, pred_map)
        sample[prediction_field] = pred

    ## add dynamic fields to dataset so we can view them in the App
    dataset.add_dynamic_sample_fields()
然后将评估应用于来自两个模型的预测:
evaluate_depth(dataset, "dpt", "gt_depth")
evaluate_depth(dataset, "marigold", "gt_depth")
计算某个模型/指标的平均性能非常简单,只需在该字段上调用DataSet的mean()方法即可:
print("Mean Error Metrics")
for model in ["dpt", "marigold"]:
    print("-"*50)
    for metric in ["rmse", "psnr", "ssim"]:
        mean_metric_value = dataset.mean(f"{model}.{metric}")
        print(f"Mean {metric} for {model}: {mean_metric_value}")
Mean Error Metrics
--------------------------------------------------
Mean rmse for dpt: 49.8915828817003
Mean psnr for dpt: 14.805904629602551
Mean ssim for dpt: 0.8398022368184576
--------------------------------------------------
Mean rmse for marigold: 104.0061165272178
Mean psnr for marigold: 7.93015537185192
Mean ssim for marigold: 0.42766803372861134
所有指标似乎都表明 DPT 的表现优于 Marigold。然而,值得注意的是,这些指标并不完美。例如,RMSE 对异常值非常敏感,而 SSIM 对小误差不太敏感。为了进行更彻底的评估,我们可以在应用程序中筛选这些指标,以便可视化模型哪些方面做得好,哪些方面做得不好,或者哪些指标无法捕捉模型的性能。
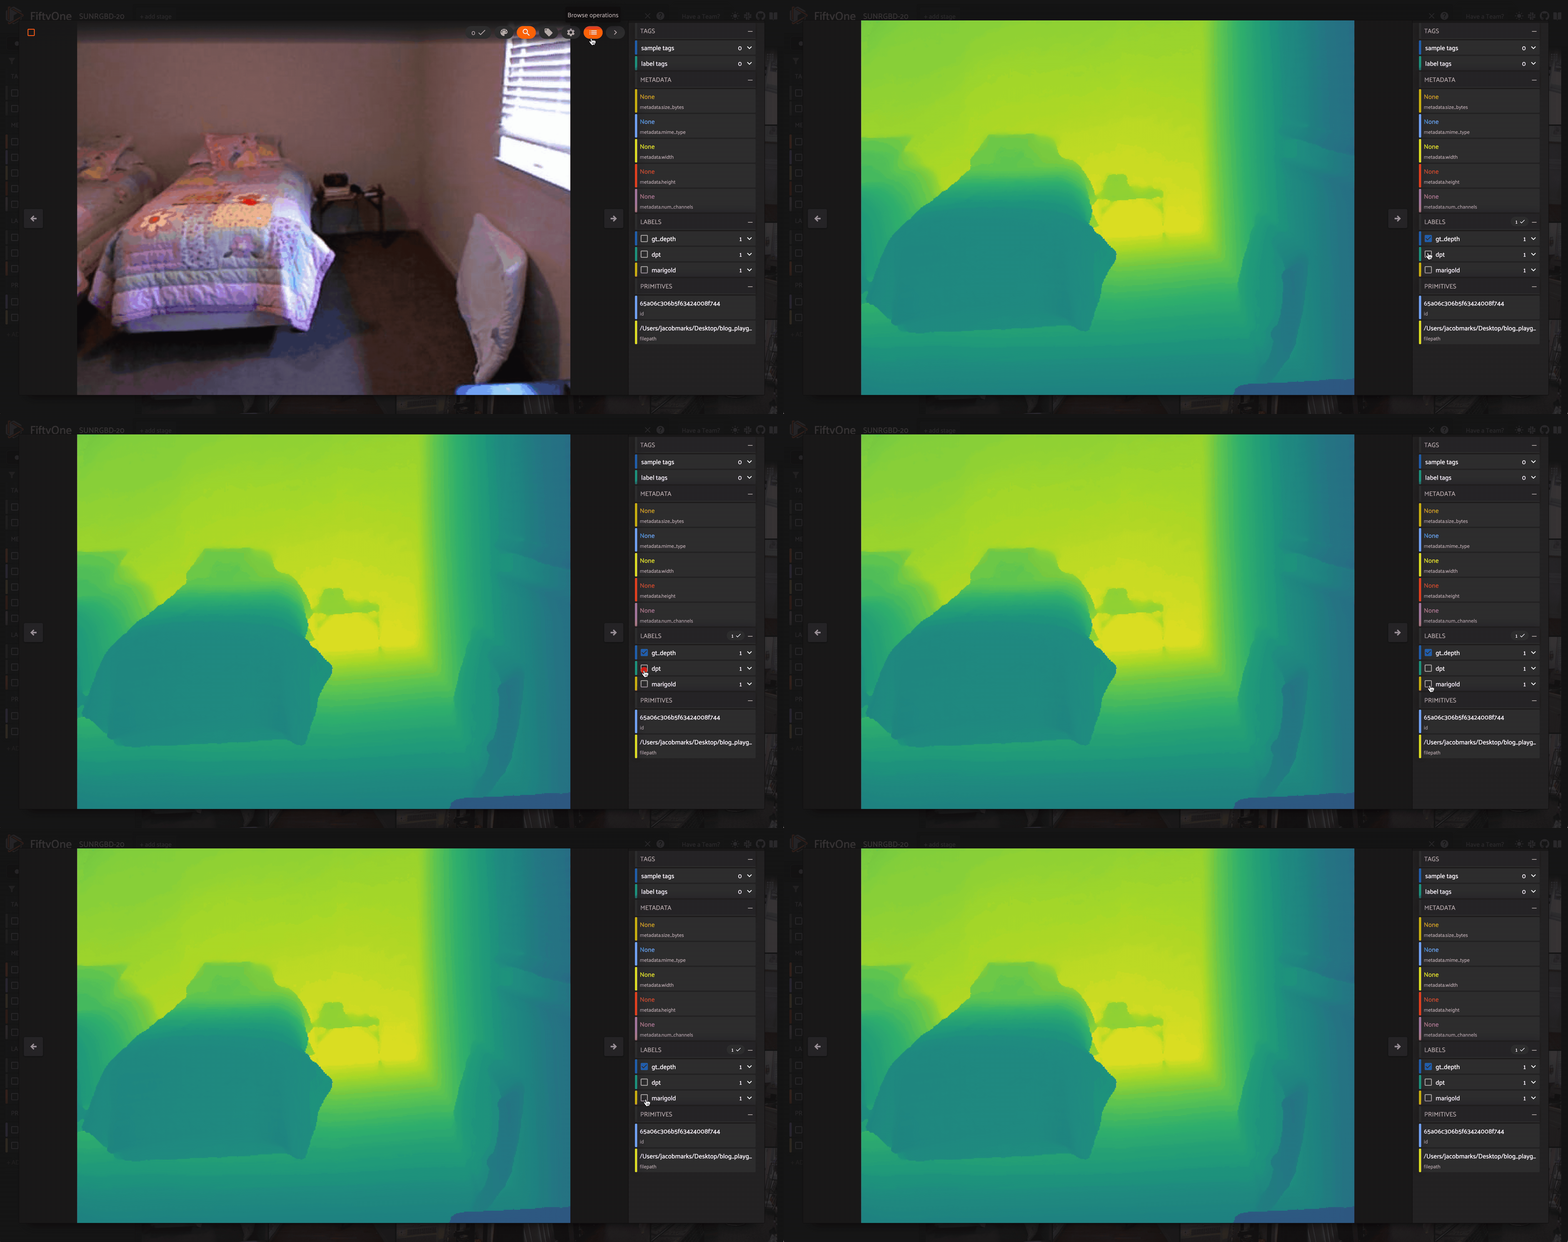
最后,打开和关闭遮罩是一种很好的方法,可以直观地显示地面实况和模型预测之间的差异:
结论
我们学习了如何在我们的数据上运行单目深度估计模型,如何使用通用指标评估预测,以及如何可视化结果。我们还了解到,单目深度估计是一项众所周知的艰巨任务。
数据质量和数量是严重的限制因素,模型通常难以推广到新的环境,并且度量并不总是模型性能的良好指标。量化模型性能的特定数值在很大程度上取决于你的处理管道。甚至你对预测深度图的定性评估也会受到配色方案和不透明度比例的严重影响。


