Functime:用于高效时间序列特征提取和预测的Python库
根据官方文档,functime 是一个用于时间序列预测的机器学习库,而其:
- 功能齐全: 功能强大、易于使用的 API,可用于预测和特征工程(tsfresh、Catch22)。
- 速度快: 在笔记本电脑上几秒钟内预测 100,000 个时间序列。
- 高效: 使用 Polars 可并行提取 100 个时间序列特征*。
- 久经考验: 可产生实际业务影响并在竞赛中获胜的算法。
Functime 是为时间序列预测和特征提取精心打造的强大库,专门用于处理庞大的面板数据集。functime 的与众不同之处在于其独特的预处理选项和创新的交叉验证分割器,开创了时间序列分析多功能性的新时代。
functime 拥有无与伦比的速度和效率,能够在数秒内处理 100,000 个时间序列。这一非凡的速度是通过巧妙地利用 Polars 进行并行特征工程实现的,这也是其致力于以前所未有的速度提供结果的有力证明。
然而,functime 已超越了单纯速度的范畴;它是一个强大的伙伴,拥有成熟的机器学习算法和强大的框架,支持所有预测器的外生特征。自动化是它的核心,可通过 FLAML 的强大功能无缝处理复杂的任务,如管理滞后和超参数调整。
安装
要安装最新的 functime,请运行以下命令:
pip install functimeFunctime 附带额外选项。例如,安装带有大型语言模型(LLM)和 lightgbm 功能的 functime:
pip install "functime[llm,lgb]"ann: 使用 ann(近似近邻)预报器
cat: 使用 catboost 预测器
xgb: 使用 xgboost 预报器
lgb: 使用 lightgbm 预报器
llm: 使用 LLM 驱动的预测分析器
plot: 使用绘图功能
预处理
Funtime 通过 Polars 利用并行化时间序列预处理。Funtime 的每个预处理器都以面板 DataFrame 作为输入,并行地对每个时间序列进行局部转换,类似于以每个时间序列为基础的分组操作。
这些变换的作用是稳定时间序列,如使用 boxcox 来稳定方差,或通过应用初差或去趋势来使其静止。某些变换(如差分和去趋势)是可逆的,便于将预测变换后的时间序列转换回原始比例,从而增加其实用性。
示例
我们将直观展示常用的时间序列预处理技术在时间序列转换前后的效果。这些转换会使时间序列看起来更 "乖巧",从而使时间序列更容易预测。
#Importing the libraries and the dataset
import polars as pl
from functime.plotting import plot_forecasts, plot_panel
from functime.preprocessing import (
    boxcox,
    deseasonalize_fourier,
    detrend,
    diff,
    fractional_diff,
    scale,
    yeojohnson,
)
data = pl.read_parquet("https://github.com/TracecatHQ/functime/raw/main/data/commodities.parquet")
entity_col, time_col, target_col = data.columns
data.head()
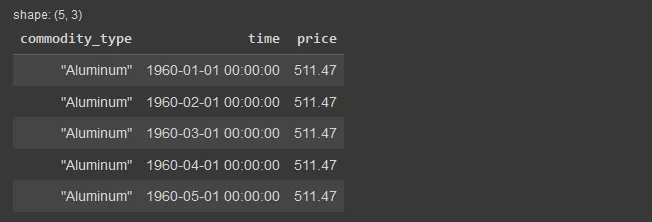
data.get_column("commodity_type").n_unique()共有 71 种商品。
most_volatile_commodities = (
    data.group_by(entity_col)
    .agg((pl.col(target_col).std() / pl.col(target_col).mean()).alias("cv"))
    .top_k(k=4, by="cv")
)
most_volatile_commodities

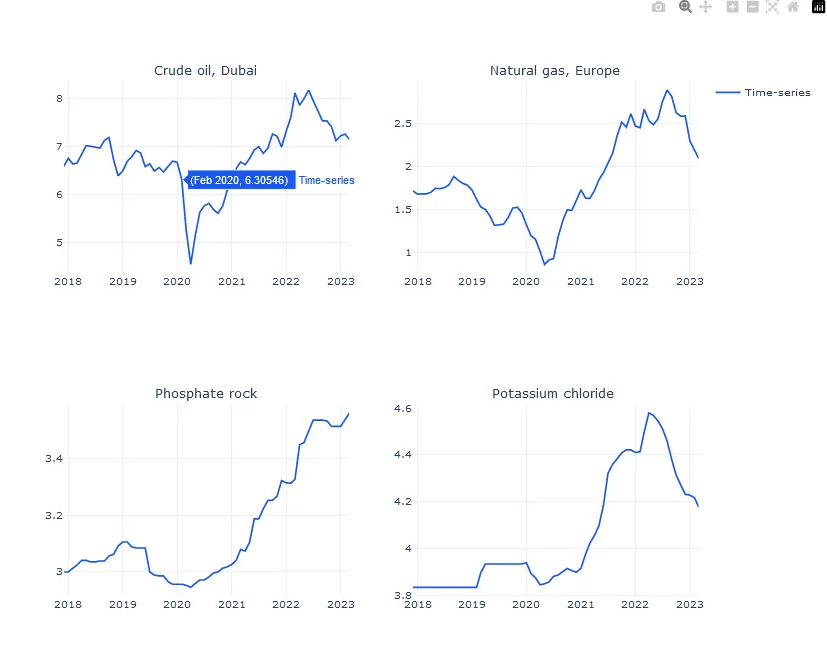
按变异系数显示波动最大的 4 个时间序列。
selected = most_volatile_commodities.get_column(entity_col)
y = data.filter(pl.col(entity_col).is_in(selected))
figure = plot_panel(y=y, height=800, width=1000)
figure.show()
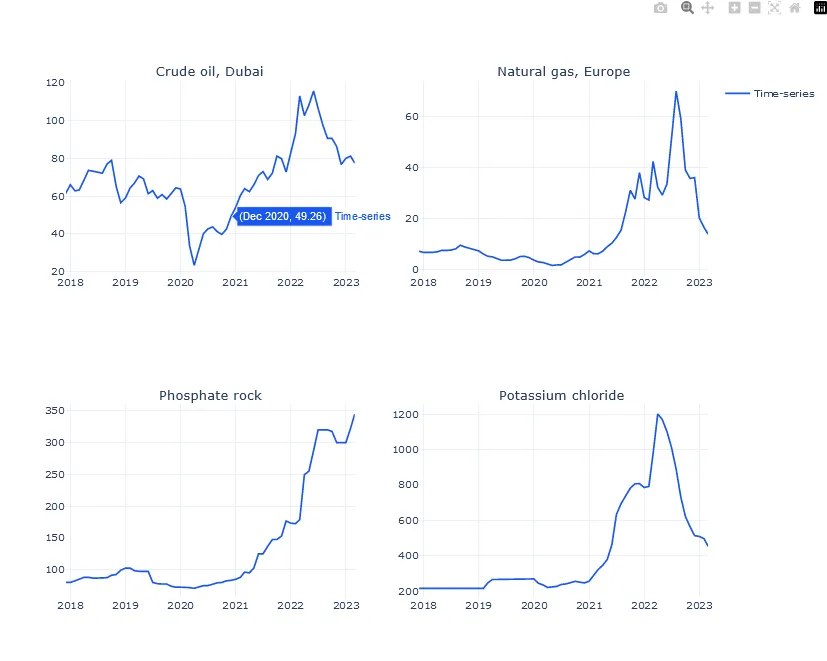
让我们试试能否对这些时间序列进行预处理,使其更易于预测。
去趋势化
transformer = detrend(freq="1mo", method="linear")
y_detrended = y.pipe(transformer).collect()
figure = plot_forecasts(
    y_true=y, y_pred=y_detrended.group_by(entity_col).tail(64), height=800, width=1000
)
figure.show()
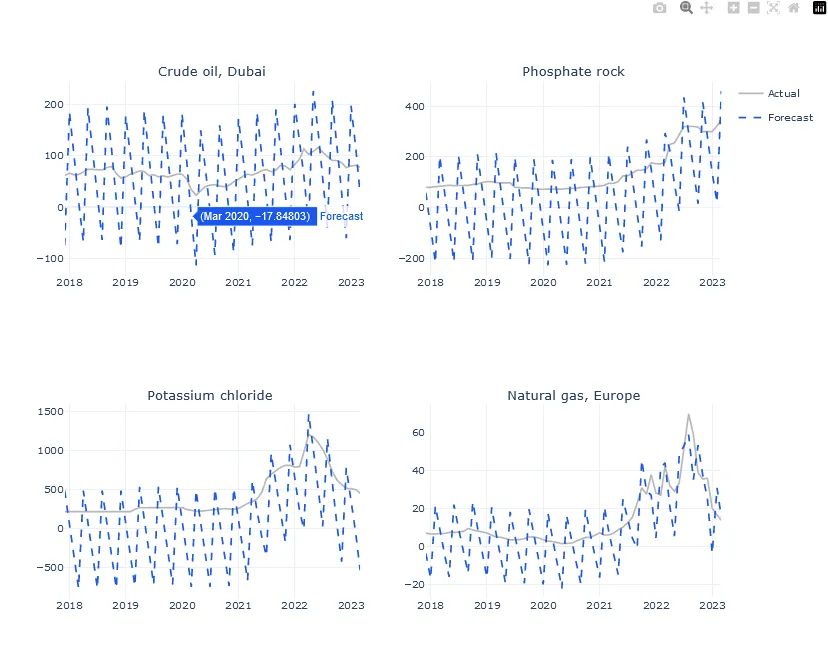
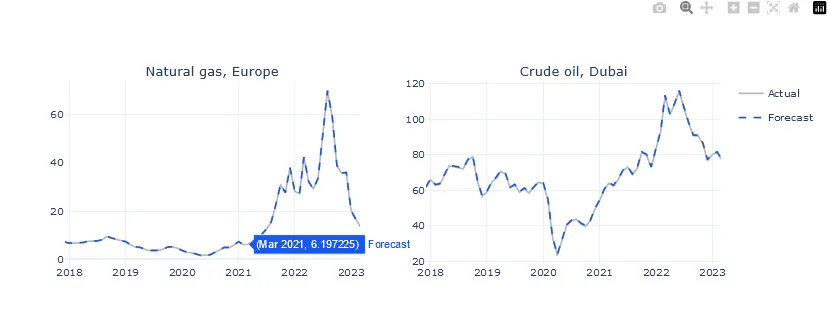
反转变换,
y_original = transformer.invert(y_detrended).group_by(entity_col).tail(64).collect()
subset = ["Natural gas, Europe", "Crude oil, Dubai"]
figure = plot_forecasts(
    y_true=y.filter(pl.col(entity_col).is_in(subset)),
    y_pred=y_original,
    height=400,
    width=1000,
)
figure.show()
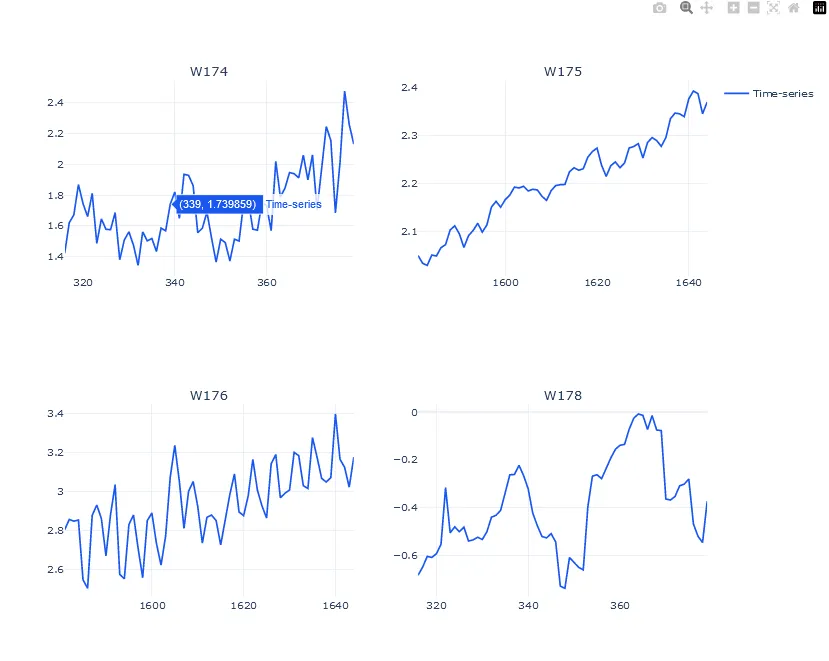
去季节化
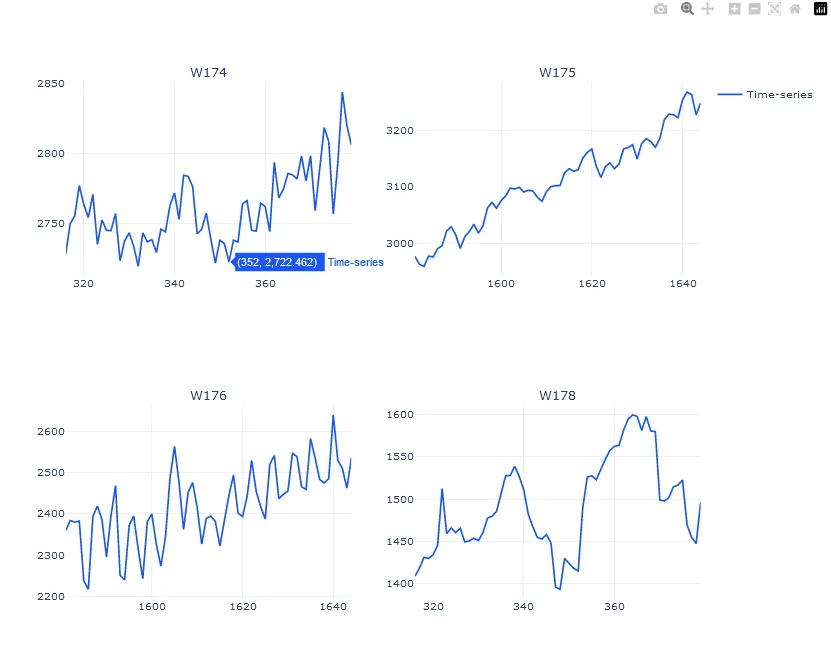
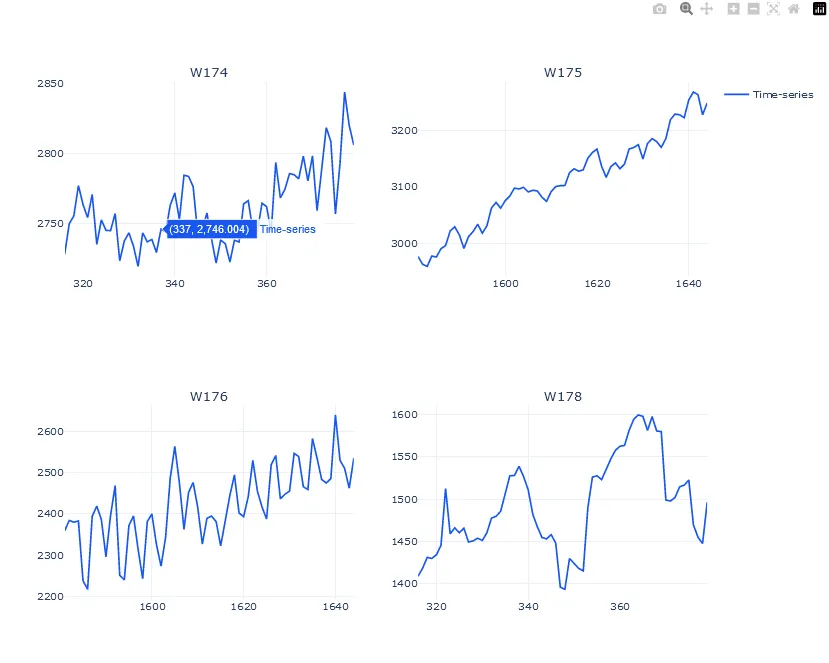
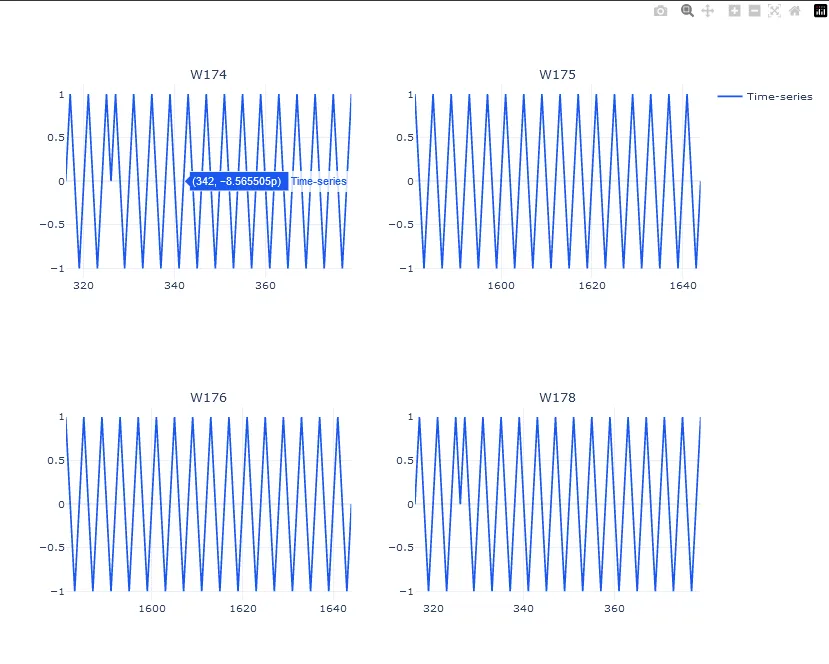
M4 小时数据集具有明显的季节性特征。Functime 支持通过对傅里叶项的残差回归来去季节化,从而建立季节性模型。
m4_data = pl.read_parquet("https://github.com/TracecatHQ/functime/raw/main/data/m4_1w_train.parquet")
m4_entity_col, m4_time_col, m4_target_col = m4_data.columns
y_m4 = m4_data.filter(pl.col(m4_entity_col).is_in(["W174", "W175", "W176", "W178"]))
figure = plot_panel(y=y_m4, height=800, width=1000)
figure.show()
# Fourier Terms
transformer = deseasonalize_fourier(sp=12, K=3)
y_deseasonalized = y_m4.pipe(transformer).collect()
y_seasonal = transformer.state.artifacts["X_seasonal"].collect()
figure = plot_panel(
    y=y_seasonal.group_by(m4_entity_col).tail(64), height=800, width=1000
)
figure.show()
y_deseasonalized = y_m4.pipe(transformer).collect()
y_original = transformer.invert(y_deseasonalized).collect()
figure = plot_panel(
    y=y_original.group_by(m4_entity_col).tail(64), height=800, width=1000
)
figure.show()
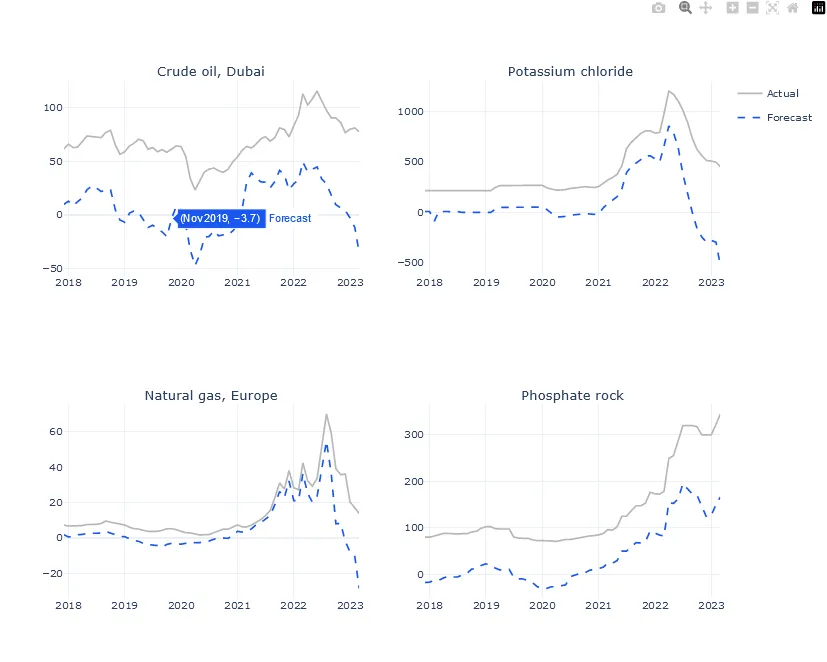
差分
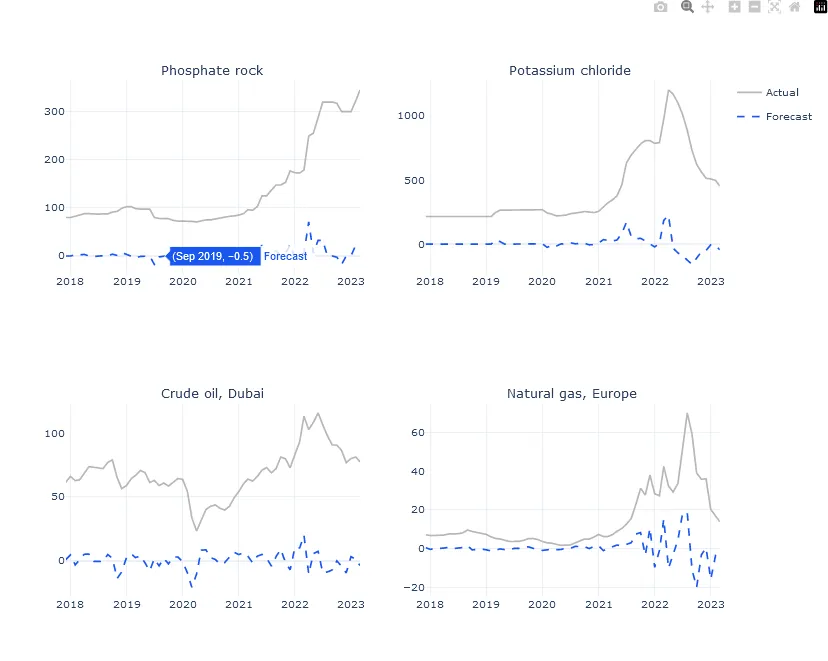
一阶差分法用于时间序列分析,通过求取连续观测值之间的差值,将非平稳时间序列转换为平稳时间序列。假设时间序列具有单位根 1。
transformer = diff(order=1)
y_diff = y.pipe(transformer).collect()
figure = plot_forecasts(
    y_true=y, y_pred=y_diff.group_by(entity_col).tail(64), height=800, width=1000
)
figure.show()
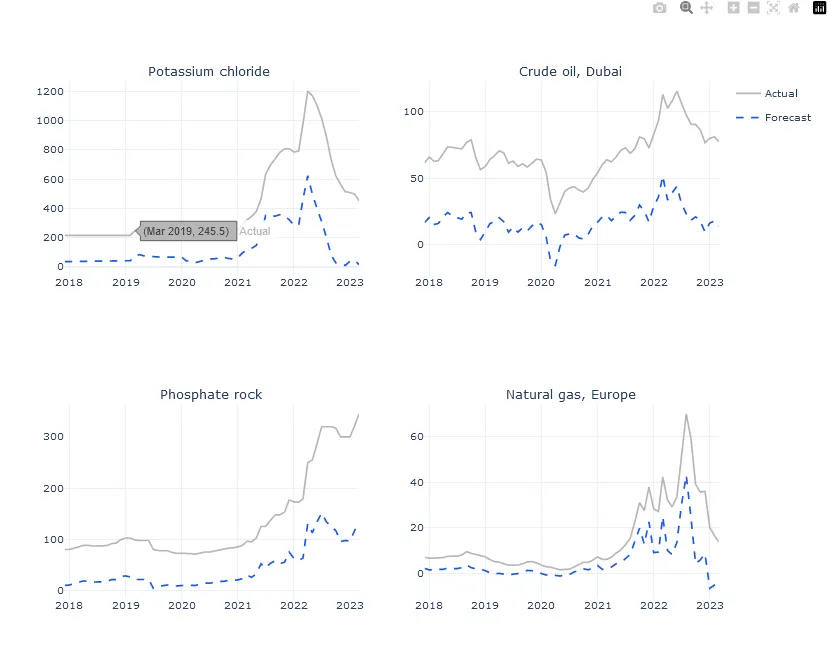
分数差分法
有时,我们需要在不删除时间序列中所有记忆的情况下使时间序列静止。这在特定的预测任务中尤其有用,因为在这些任务中,下一个值取决于过去很长一段时间的值(如预测股票价格)。在这种情况下,我们可以使用分数差分法。我们可以注意到这些图与之前的图之间的差异。值得使用诸如增强型 Dickey-fuller 检验等评分函数进行多次检验,以确定使时间序列成为静态的最小 d 值。
transformer = fractional_diff(d=0.3, min_weight=1e-3)
y_diff = y.pipe(transformer).collect()
figure = plot_forecasts(
    y_true=y, y_pred=y_diff.group_by(entity_col).tail(64), height=800, width=1000
)
figure.show()
季节性差异
transformer = diff(order=1, sp=12)
y_seas_diff = y.pipe(transformer).collect()
figure = plot_forecasts(
    y_true=y, y_pred=y_seas_diff.group_by(entity_col).tail(64), height=800, width=1000
)
figure.show()
局部缩放
局部缩放是在多个时间序列中进行缩放变换(减去平均值,除以标准差)的并行版本。
transformer = scale(use_mean=True, use_std=True)
y_scaled = y_m4.pipe(transformer).collect()
figure = plot_panel(y=y_scaled.group_by(m4_entity_col).tail(64), height=800, width=1000)
figure.show()
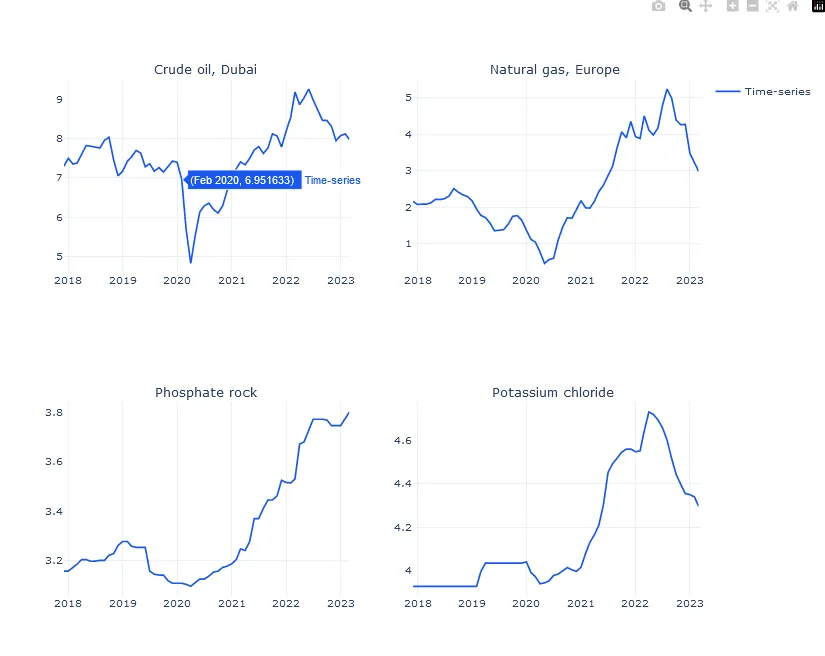
Box-Cox
这种变换用于稳定时间序列的方差。它要求所有值都是正值。
transformer = boxcox(method="mle")
y_boxcox = y.pipe(transformer).collect()
figure = plot_panel(y=y_boxcox.group_by(entity_col).tail(64), height=800, width=1000)
figure.show()
Yeo-Johnson
这种变换与 Box-Cox 类似,但没有严格的正向要求。
transformer = yeojohnson()
y_yeojohnson = y.pipe(transformer).collect()
figure = plot_panel(
    y=y_yeojohnson.group_by(entity_col).tail(64), height=800, width=1000
)
figure.show()
特征提取
import polars as pl
import numpy as np
from functime.feature_extractors import FeatureExtractor, binned_entropy
# Load commodities price data
y = pl.read_parquet("https://github.com/TracecatHQ/functime/raw/main/data/commodities.parquet")
# Get column names ("commodity_type", "time", "price")
entity_col, time_col, value_col = y.columns
# Extract a single feature from a single time-series
binned_entropy = binned_entropy(
    pl.Series(np.random.normal(0, 1, size=10)),
    bin_count=10
)
# Also works on LazyFrames with query optimization
features = (
    pl.LazyFrame({
        "index": [0, 1, 2, 3, 4, 5, 6, 7, 8, 9],
        "value": np.random.normal(0, 1, size=10)
    })
    .select(
        binned_entropy=pl.col("value").ts.binned_entropy(bin_count=10),
        lempel_ziv_complexity=pl.col("value").ts.lempel_ziv_complexity(threshold=3),
        longest_streak_above_mean=pl.col("value").ts.longest_streak_above_mean(),
    )
    .collect()
)
# Extract features blazingly fast on many stacked time-series using `group_by`
features = (
    y.group_by(entity_col)
    .agg(
        binned_entropy=pl.col(value_col).ts.binned_entropy(bin_count=10),
        lempel_ziv_complexity=pl.col(value_col).ts.lempel_ziv_complexity(threshold=3),
        longest_streak_above_mean=pl.col(value_col).ts.longest_streak_above_mean(),
    )
)
# Extract features blazingly fast on windows of many time-series using `group_by_dynamic`
features = (
    # Compute rolling features at yearly intervals
    y.group_by_dynamic(
        time_col,
        every="12mo",
        by=entity_col,
    )
    .agg(
        binned_entropy=pl.col(value_col).ts.binned_entropy(bin_count=10),
        lempel_ziv_complexity=pl.col(value_col).ts.lempel_ziv_complexity(threshold=3),
        longest_streak_above_mean=pl.col(value_col).ts.longest_streak_above_mean(),
    )
)
预测
import polars as pl
from functime.cross_validation import train_test_split
from functime.seasonality import add_fourier_terms
from functime.forecasting import linear_model
from functime.preprocessing import scale
from functime.metrics import mase
# Load commodities price data
y = pl.read_parquet("https://github.com/TracecatHQ/functime/raw/main/data/commodities.parquet")
entity_col, time_col = y.columns[:2]
# Time series split
y_train, y_test = y.pipe(train_test_split(test_size=3))
# Fit-predict
forecaster = linear_model(freq="1mo", lags=24)
forecaster.fit(y=y_train)
y_pred = forecaster.predict(fh=3)
# functime functional design
# fit-predict in a single line
y_pred = linear_model(freq="1mo", lags=24)(y=y_train, fh=3)
# Score forecasts in parallel
scores = mase(y_true=y_test, y_pred=y_pred, y_train=y_train)
# Forecast with target transforms and feature transforms
forecaster = linear_model(
    freq="1mo",
    lags=24,
    target_transform=scale(),
    feature_transform=add_fourier_terms(sp=12, K=6)
)
# Forecast with exogenous regressors!
# Just pass them into X
X = (
    y.select([entity_col, time_col])
    .pipe(add_fourier_terms(sp=12, K=6)).collect()
)
X_train, X_future = y.pipe(train_test_split(test_size=3))
forecaster = linear_model(freq="1mo", lags=24)
forecaster.fit(y=y_train, X=X_train)
y_pred = forecaster.predict(fh=3, X=X_future)
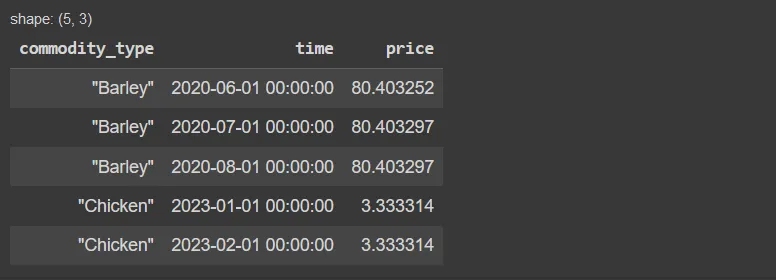
y_pred.head()
构建自定义变换器
Functime 有一个易于使用且功能强大的 @transformer 装饰器,用于实现新的转换器。下面是一个示例:
@transformer
def lag(lags: List[int]):
    """Applies lag transformation to a LazyFrame.
    Parameters
    ----------
    lags : List[int]
        A list of lag values to apply.
    """
    def transform(X: pl.LazyFrame) -> pl.LazyFrame:
        entity_col = X.columns[0]
        time_col = X.columns[1]
        max_lag = max(lags)
        lagged_series = [
            (
                pl.all()
                .exclude([entity_col, time_col])
                .shift(lag)
                .over(entity_col)
                .suffix(f"__lag_{lag}")
            )
            for lag in lags
        ]
        X_new = (
            # Pre-sorting seems to improve performance by ~20%
            X.sort(by=[entity_col, time_col])
            .select(
                pl.col(entity_col).set_sorted(),
                pl.col(time_col).set_sorted(),
                *lagged_series,
            )
            .group_by(entity_col)
            .agg(pl.all().slice(max_lag))
            .explode(pl.all().exclude(entity_col))
        )
        artifacts = {"X_new": X_new}
        return artifacts
    return transform


