时间序列交叉验证:提高预测的准确性
简介
在数据分析中,预测建模的准确性(尤其是时间序列数据)至关重要。时间序列交叉验证在这种情况下脱颖而出,成为一项关键技术,旨在有效评估时间序列模型的性能。与传统的交叉验证方法不同,时间序列交叉验证解决了时间相关数据的独特挑战,确保适当考虑时间顺序和依赖性。本文深入探讨了时间序列交叉验证的要点,重点关注其方法、实际应用以及从业者必须考虑的细微差别,以充分发挥其潜力。

背景
时间序列交叉验证是一种用于评估时间序列模型预测性能的技术。标准的交叉验证方法假定数据点是独立且同分布的,与之不同的是,时间序列交叉验证考虑了数据的时间顺序。这对时间序列数据至关重要,因为过去的观测数据通常用于预测未来值,而数据点的顺序非常重要。
以下是时间序列交叉验证的典型工作原理:
- 保留时间顺序: 根据时间顺序而不是随机拆分数据。这意味着较早的数据点被用来预测较晚的数据点。
- 滚动或扩展窗口: 主要使用两种方法:
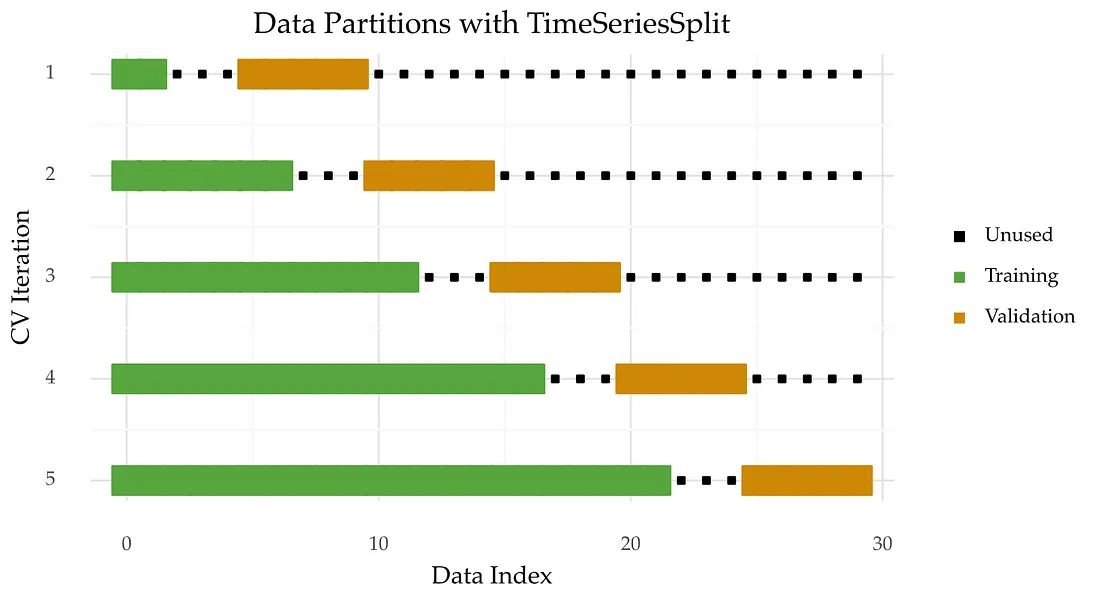
- 滚动窗口(或滑动窗口)交叉验证: 这包括在每次迭代后将训练和测试窗口向前移动固定的时间步数。例如,在前 12 个月的数据上进行训练,在下一个月进行测试,然后将两个窗口向前滚动一个月并重复。
- 扩展窗口交叉验证法: 在这种方法中,训练窗口在每次迭代中都会扩大,以包含更多数据,而测试窗口则保持固定或增长。例如,开始时在前 12 个月进行训练,在下一个月进行测试,然后在前 13 个月进行训练,在下一个月进行测试,依此类推。
- 评估: 每次迭代后,在测试集上对模型的性能进行评估。时间序列模型的标准指标包括平均绝对误差 (MAE)、平均平方误差 (MSE) 或均方根误差 (RMSE),具体取决于具体的使用情况和模型目标。
- 迭代和聚合: 对每个培训/测试期重复这一过程,并对评估指标进行汇总(如求平均值),以提供对模型性能的整体评估。
这种方法有助于确保模型的稳健性,并在未见数据上表现良好,同时尊重观察结果的时间顺序,这对保持时间序列分析的完整性至关重要。
了解时间动态
时间序列交叉验证的基础在于尊重时间序列数据的连续性。与时间相关的数据具有自相关性,即之前的数据会影响当前的数据值。这一特性要求我们在方法上进行转变,从标准交叉验证中使用的随机分区转变为保留数据点时间顺序的策略。因此,我们的主要目标是模拟现实世界中的情景,即仅使用过去和现在的数据来预测未来的结果。
实践中的方法
从业人员通常采用两种主要的时间序列交叉验证方法:滚动窗口和扩展窗口技术。每种方法都能满足不同的需求,并对模型随时间变化的性能提供独特的见解。
- 滚动窗口交叉验证: 这种技术是将训练窗口和测试窗口在时间上向前移动,通常是一个时间步长。它能动态地反映模型的性能和适应新数据的能力。例如,金融时间序列预测中的滚动窗口方法可以帮助评估模型预测每日股票价格的能力,并根据市场波动进行调整。
- 扩展窗口交叉验证: 训练窗口的大小每一步都在增加,而测试窗口则保持不变。这种方法有利于捕捉长期趋势,了解更多历史数据如何影响预测准确性。例如,扩大窗口验证可以揭示模型在经济预测中如何适应不同的经济周期。
实际考虑因素
有效实施时间序列交叉验证需要注意几个实际考虑因素:
- 静态性: 确保时间序列数据的静态性至关重要,这意味着其统计特性不会随时间而改变。非静态数据会导致误导性的验证结果,因为模型可能会学习到不能很好地推广到未来的模式。
- 季节性: 考虑季节性变化至关重要,尤其是在零售或农业等行业,因为这些行业的需求模式具有很强的季节性。交叉验证框架的设计应能捕捉并评估模型准确预测这些季节性模式的能力。
- 预测范围: 预测范围的选择--即模型预测未来多远--会对验证结果产生重大影响。较短的预测范围可能侧重于近期趋势,而较长的预测范围则更具挑战性,但却能让人深入了解模型的长期预测能力。
- 性能指标: 选择正确的指标来评估模型性能至关重要。虽然 MSE 和 RMSE 很常见,但它们有时可能并不合适,主要是在数据包含异常值的情况下。平均绝对误差 (MAE) 或平均绝对百分比误差 (MAPE) 等指标有时能更真实地反映模型的预测准确性。
代码
下面是一个使用合成数据集演示时间序列交叉验证的 Python 综合示例。我们将在一个代码块中涵盖数据集生成、特征工程、超参数调整、模型评估、绘图和结果解释:
import numpy as np
import pandas as pd
from sklearn.linear_model import Ridge
from sklearn.model_selection import TimeSeriesSplit
from sklearn.metrics import mean_squared_error
import matplotlib.pyplot as plt
from sklearn.preprocessing import PolynomialFeatures
from sklearn.pipeline import make_pipeline
# Generate synthetic time series data
np.random.seed(42)
time = np.arange(100)
y = np.sin(time) + np.random.normal(scale=0.1, size=time.size)
data = pd.DataFrame({'Time': time, 'Value': y})
# Feature engineering: creating lag features
for lag in range(1, 4):
    data[f'lag_{lag}'] = data['Value'].shift(lag)
data.dropna(inplace=True)  # Remove rows with NaN values after shifting
# Define the model and hyperparameters
model = Ridge()
hyperparameters = {'alpha': [0.1, 1, 10]}
tscv = TimeSeriesSplit(n_splits=5)
best_score = float('inf')
best_alpha = None
# Hyperparameter tuning with time series cross-validation
for alpha in hyperparameters['alpha']:
    temp_model = make_pipeline(PolynomialFeatures(degree=2), Ridge(alpha=alpha))
    scores = []

    for train_index, test_index in tscv.split(data):
        train, test = data.iloc[train_index], data.iloc[test_index]
        X_train, y_train = train.drop('Value', axis=1), train['Value']
        X_test, y_test = test.drop('Value', axis=1), test['Value']

        temp_model.fit(X_train, y_train)
        y_pred = temp_model.predict(X_test)
        score = mean_squared_error(y_test, y_pred)
        scores.append(score)

    avg_score = np.mean(scores)

    if avg_score < best_score:
        best_score = avg_score
        best_alpha = alpha
# Final model training
final_model = make_pipeline(PolynomialFeatures(degree=2), Ridge(alpha=best_alpha))
X, y = data.drop('Value', axis=1), data['Value']
final_model.fit(X, y)
# Plotting the results
plt.figure(figsize=(10, 6))
plt.plot(data['Time'], y, label='Actual')
plt.plot(data['Time'], final_model.predict(X), label='Predicted')
plt.title(f'Time Series Prediction (Best alpha: {best_alpha})')
plt.xlabel('Time')
plt.ylabel('Value')
plt.legend()
plt.show()
# Interpretations
print(f"Best alpha value: {best_alpha}")
print(f"Model's average MSE across folds: {best_score}")
# The model's performance can be assessed by comparing the actual and predicted values over time.
# A lower MSE indicates a better fitting model. The plot and MSE provide insights into the model's accuracy and its ability to generalize over time.
该代码块将介绍创建合成数据集、生成用于时间序列预测的滞后特征、调整超参数 alpha 对于岭回归模型,将使用时间序列交叉验证,然后使用最佳超参数训练最终模型。最后,绘制实际值与预测值的对比图,以直观显示模型的性能。它还会打印出最佳超参数值和模型在交叉验证褶皱中的均方误差(MSE)。解释部分将介绍如何根据这些结果评估模型的性能。

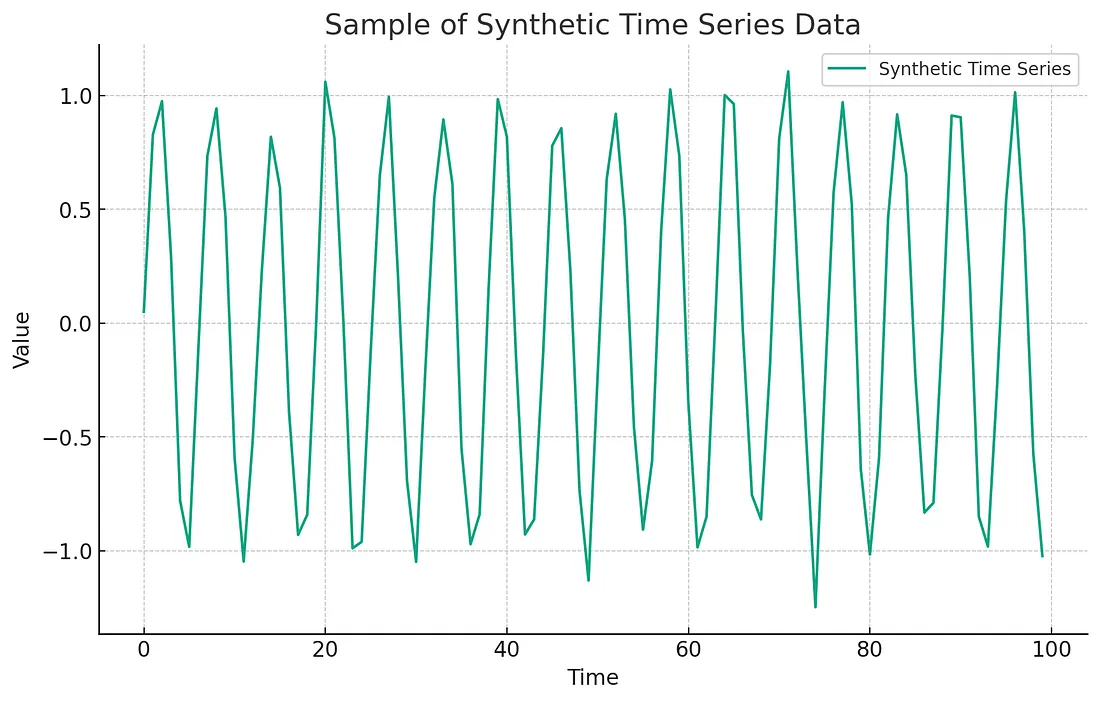
上图显示的是为示例生成的合成时间序列数据样本。它表示的是一个正弦波,其中添加了一些正常噪声,是实际用于测试和演示模型的典型时间序列数据。

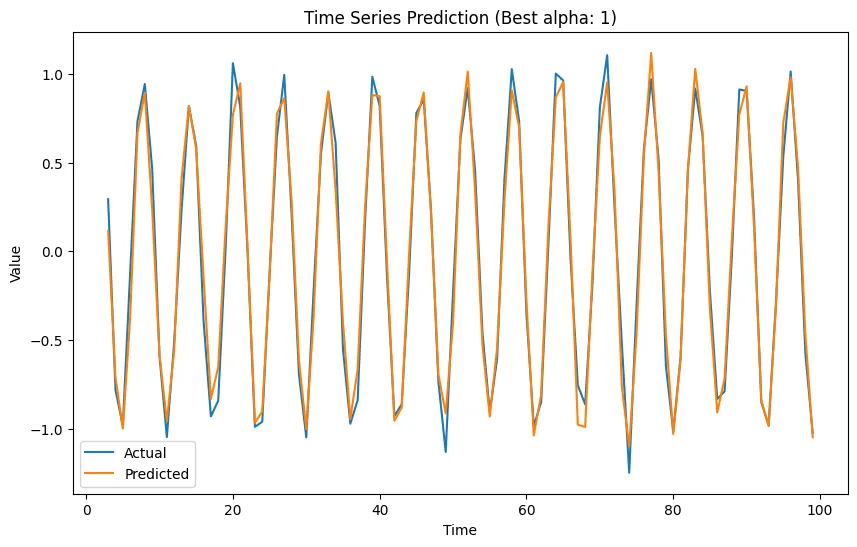
该图显示了一个时间序列数据集在 100 个时间步长内的实际值与预测值的对比。蓝线代表精确值,橙线代表从模型中获得的预测值,该模型可能就是前面讨论的那个模型,其优化超参数 alpha 设为 1。
预测值紧跟实际值,表明模型与数据拟合良好。模型有效地捕捉到了基本模式,鉴于数据的周期性,这可能是某种周期性或季节性趋势。
预测值和实际值之间存在微小偏差,这在任何模型中都是可以预料到的,因为模型无法完美预测噪音或其他因素。两条线的紧密吻合表明模型具有很高的准确性。
波峰和波谷的规律性表明,数据具有周期性的固体成分,模型可以学习并再现这种成分。预测在整个范围内的精确度也表明,所选择的特征和超参数的调整使得模型能够很好地概括该时间序列数据。
总之,可视化结果表明,利用经过良好调整的参数成功建立了时间序列模型,从而得出了与实际观测结果高度一致的预测结果。
结论
对于处理时间序列数据的从业人员来说,时间序列交叉验证是不可或缺的。分析师可以通过仔细选择适当的方法并考虑时间序列的独特性,全面了解其模型的性能。这种方法的严谨性不仅确保了预测模型的准确性,还确保了模型在一段时间内的稳健性和可靠性,从而为各个领域提供可操作的见解,促进数据驱动型决策的制定。通过细致地应用时间序列交叉验证,从业人员可以驾驭复杂的时间序列数据,并获得有价值的预测见解。


