Pandas AI数据分析入门指南
我们生活在一个生成式人工智能无处不在的时代。想象一下,如果你可以使用生成式人工智能来分析你的数据,事情会变得多么简单。
这正是Pandas AI带来的。通过简单的提示,我们可以快速分析和操作数据集,而无需将数据发送到其他地方。
本文将探讨如何利用Pandas AI进行数据分析任务。在文章中,我们将学习以下内容:
- Pandas AI的设置
- 使用Pandas AI进行数据探索
- 使用Pandas AI进行数据可视化
- Pandas AI的高级用法
如果你已经准备好学习,那就让我们开始吧!
Pandas AI设置
Pandas AI是一个Python包,它将大型语言模型(LLM)的功能集成到Pandas API中。我们可以使用标准的Pandas API与生成式人工智能的增强功能,将Pandas变成一个可以对话的工具。
我们主要想使用Pandas AI,是因为它提供了一个简单的流程。这个包可以自动使用简单的提示来分析数据,而无需编写复杂的代码。
介绍完毕,让我们进入实践环节。
首先,我们需要在做任何事情之前安装这个包。
pip install pandasai
接下来,我们需要设置用于Pandas AI的LLM。有多种选择,例如OpenAI GPT和HuggingFace。但是,在本教程中,我们将使用OpenAI GPT。
将OpenAI模型设置为Pandas AI非常简单,但你需要OpenAI的API密钥。
如果一切准备就绪,让我们使用下面的代码来设置Pandas AI的LLM。
from pandasai.llm import OpenAI


llm = OpenAI(api_token="Your OpenAI API Key")
现在你已经准备好使用Pandas AI进行数据分析了。
数据探索与Pandas AI
让我们从一个样本数据集开始,并尝试使用Pandas AI进行数据探索。在这个例子中,我将使用Seaborn包中的泰坦尼克号数据。
import seaborn as sns

from pandasai import SmartDataframe


data = sns.load_dataset('titanic')

df = SmartDataframe(data, config = {'llm': llm})
我们需要将它们传递给Pandas AI的SmartDataFrame对象以启动Pandas AI。之后,我们就可以对我们的DataFrame进行会话式操作了。
让我们尝试一个简单的问题。
response = df.chat("""Return the survived class in percentage""")


response
乘客的存活率为:38.38%
根据提示,Pandas AI能够得出解决方案并回答我们的问题。
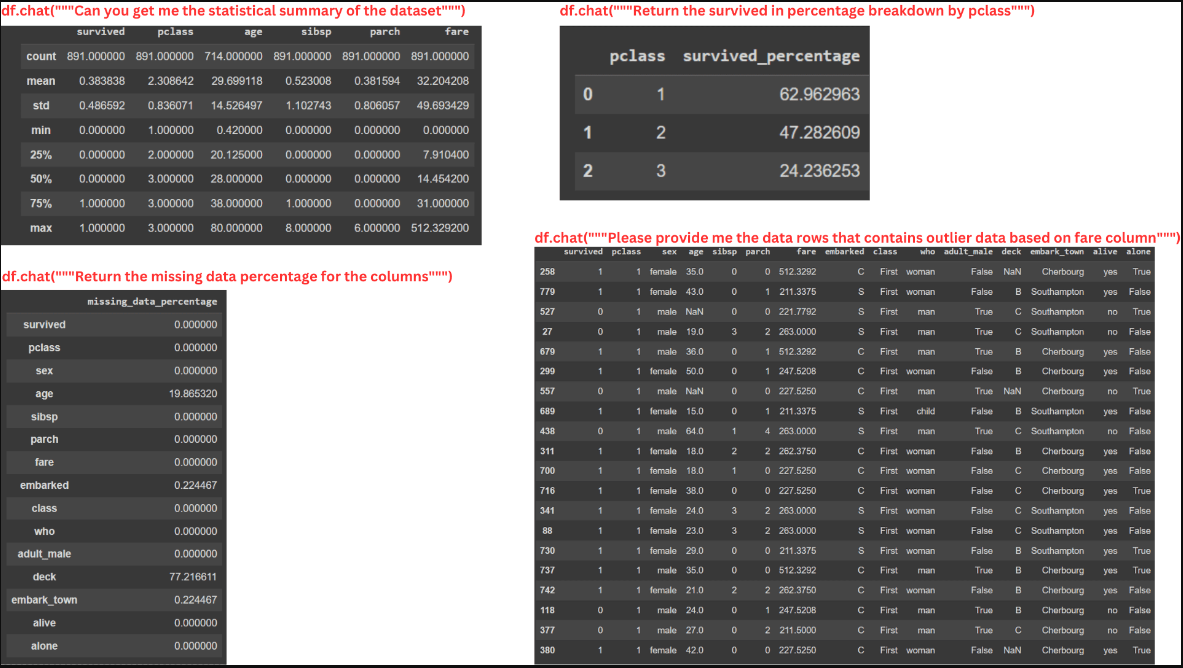
我们可以向Pandas AI提出在DataFrame对象中可以找到答案的问题。例如,以下是几个用于分析数据的提示。
#Data Summary

summary = df.chat("""Can you get me the statistical summary of the dataset""")


#Class percentage

surv_pclass_perc = df.chat("""Return the survived in percentage breakdown by pclass""")


#Missing Data

missing_data_perc = df.chat("""Return the missing data percentage for the columns""")


#Outlier Data

outlier_fare_data = response = df.chat("""Please provide me the data rows that

contains outlier data based on fare column""") 
从上面的图片中,你可以看到即使提示相当复杂,Pandas AI仍然可以使用DataFrame对象提供信息。
然而,由于包受限于我们在SmartDataFrame对象上传递的LLM,Pandas AI无法处理过于复杂的计算。
数据可视化与Pandas AI
Pandas AI不仅有助于数据探索,还可以进行数据可视化。只要我们指定提示,Pandas AI就会给出可视化输出。
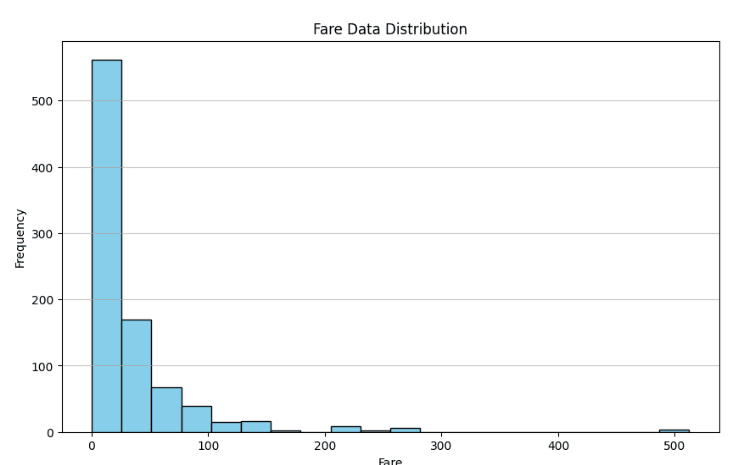
让我们尝试一个简单的例子。
response = df.chat('Please provide me the fare data distribution visualization')


response
在上面的例子中,我们要求Pandas AI可视化“Fare”列的分布情况。输出结果是数据集中船票价格的条形图分布。
就像数据探索一样,你可以进行任何类型的数据可视化。然而,Pandas AI仍然无法处理更复杂的可视化过程。
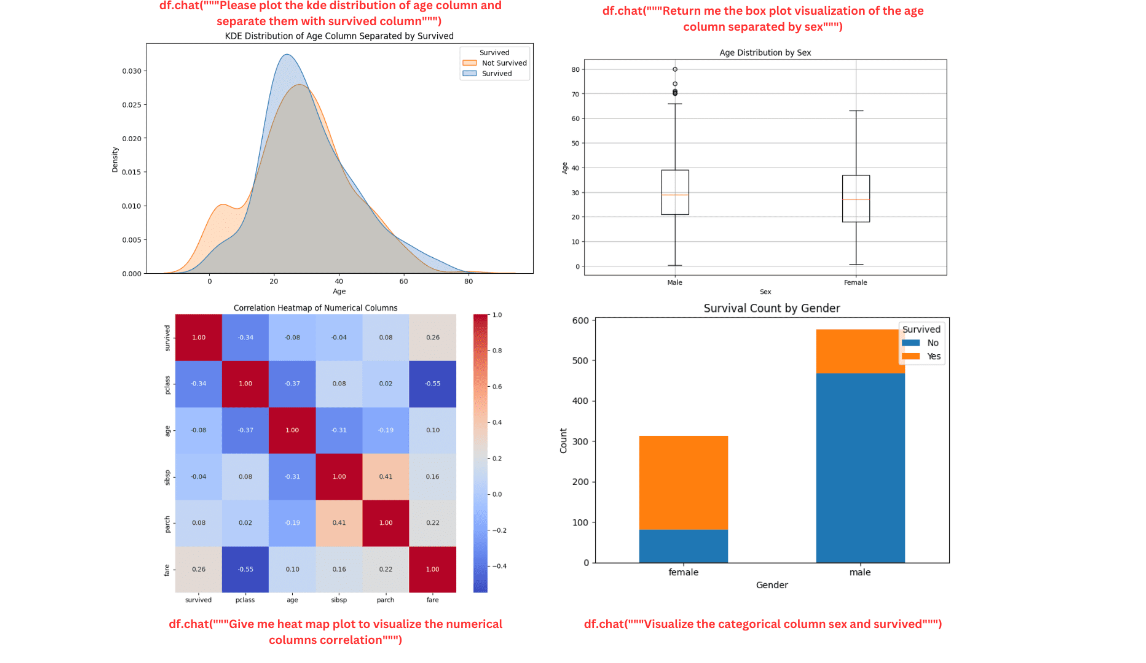
以下是使用Pandas AI进行数据可视化的其他一些示例。
kde_plot = df.chat("""Please plot the kde distribution of age column and separate them with survived column""")


box_plot = df.chat("""Return me the box plot visualization of the age column separated by sex""")


heat_map = df.chat("""Give me heat map plot to visualize the numerical columns correlation""")


count_plot = df.chat("""Visualize the categorical column sex and survived""") 
图表看起来既美观又整洁。如果需要,你可以继续向Pandas AI询问更多细节。
Pandas AI的高级用法
我们可以使用Pandas AI中的几个内置API来改进Pandas AI的使用体验。
清除缓存
默认情况下,Pandas AI对象中的所有提示和结果都存储在本地目录中,以减少处理时间并缩短Pandas AI调用模型所需的时间。
然而,这个缓存有时会使Pandas AI的结果变得无关紧要,因为它们会考虑过去的结果。因此,清除缓存是一个好习惯。你可以使用以下代码来清除它们。
import pandasai as pai

pai.clear_cache()
你也可以在开始时关闭缓存。
df = SmartDataframe(data, {"enable_cache": False})
这样,从一开始就不会存储任何提示或结果。
自定义头部
可以将一个样本头部DataFrame传递给Pandas AI。如果你不想将一些私有数据与LLM共享,或者只是想向Pandas AI提供一个示例,这将非常有用。
为此,你可以使用以下代码。
from pandasai import SmartDataframe

import pandas as pd


# head df

head_df = data.sample(5)


df = SmartDataframe(data, config={

    "custom_head": head_df,

    'llm': llm

})
Pandas AI技能和代理
Pandas AI允许用户传递一个示例函数,并使用代理决策来执行它。例如,下面的函数将两个不同的DataFrame组合在一起,我们传递一个示例绘图函数给Pandas AI代理来执行。
import pandas as pd

from pandasai import Agent

from pandasai.skills import skill


employees_data = {

    "EmployeeID": [1, 2, 3, 4, 5],

    "Name": ["John", "Emma", "Liam", "Olivia", "William"],

    "Department": ["HR", "Sales", "IT", "Marketing", "Finance"],

}


salaries_data = {

    "EmployeeID": [1, 2, 3, 4, 5],

    "Salary": [5000, 6000, 4500, 7000, 5500],

}


employees_df = pd.DataFrame(employees_data)

salaries_df = pd.DataFrame(salaries_data)


# Function doc string to give more context to the model for use of this skill

@skill

def plot_salaries(names: list[str], salaries: list[int]):

    """

    Displays the bar chart  having name on x-axis and salaries on y-axis

    Args:

        names (list[str]): Employees' names

        salaries (list[int]): Salaries

    """

    # plot bars

    import matplotlib.pyplot as plt


    plt.bar(names, salaries)

    plt.xlabel("Employee Name")

    plt.ylabel("Salary")

    plt.title("Employee Salaries")

    plt.xticks(rotation=45)


    # Adding count above for each bar

    for i, salary in enumerate(salaries):

        plt.text(i, salary + 1000, str(salary), ha='center', va='bottom')

    plt.show()


agent = Agent([employees_df, salaries_df], config = {'llm': llm})

agent.add_skills(plot_salaries)


response = agent.chat("Plot the employee salaries against names")
代理将决定是否应该使用我们分配给Pandas AI的函数。
将技能和代理结合起来,可以为你的DataFrame分析提供更可控的结果。
结论
我们已经了解了使用Pandas AI来帮助我们进行数据分析工作是多么容易。借助LLM的强大功能,我们可以减少数据分析工作中需要编写代码的部分,而是将精力集中在关键工作上。


