【教程】自定义数据上的YOLOv9分割训练
在飞速发展的计算机视觉领域,物体分割在从图像中提取有意义的信息方面起着举足轻重的作用。在众多分割算法中,YOLOv9 是一种稳健且适应性强的解决方案,它具有高效的分割能力和出色的准确性。
在本文中,我们将深入探讨 YOLOv9 在自定义数据集上进行对象分割的训练过程,并在测试数据上进行推理。
步骤 1 下载数据集
本文将使用Furniture BBox To Segmentation (SAM)。要获取 Furniture BBox To Segmentation (SAM) 数据集。你可以从 Kaggle(一个数据科学竞赛、数据集和机器学习资源的流行平台)上获取。
下载数据集后,如果数据集已打包,你可能需要从压缩格式(如 ZIP 或 TAR 文件)中提取文件。
步骤 2 安装 Ultralytics
!pip install ultralytics -qq导入软件包
from ultralytics import YOLO
import matplotlib.pyplot as plt
import cv2
import pandas as pd
import seaborn as sns
步骤 3 使用预训练的 YoloV9 权重进行推理
model = YOLO('yolov9c-seg.pt')'yolov9c-seg.pt')
model.predict("image.jpg", save=True)
- model = YOLO('yolov9c-seg.pt'):
- 此行初始化用于物体分割的 YOLOv9(只看一次)模型。
- 模型从名为 "yolov9c-seg.pt "的文件中加载,该文件包含 YOLOv9 架构的预训练权重和配置,专门用于分割任务。
- model.predict("image.jpg",save=True):
- 此行使用初始化的 YOLOv9 模型对名为 "image.jpg "的输入图像执行预测。
- 预测函数接收输入图像并进行分割,识别和划分图像中的对象。
- save=True 参数表示将保存分割结果。
步骤 4 在自定义数据集上微调 YOLOv9-seg
配置 yolov9:
dataDir = '/content/Furniture/sam_preds_training_set/'
workingDir = '/content/'
变量 dataDir 表示对象分割模型训练数据所在的目录路径。训练数据存储在"/content "目录下 "Furniture "目录下名为 "sam_preds_training_set "的目录中。
同样,变量 workingDir 表示存储主要工作文件的目录路径。
num_classes = 2
classes = ['Chair', 'Sofa']
- num_classes = 2:这个变量指定了模型将被训练分割的类别总数。在本例中,num_classes 设置为 2,表示模型将学习识别两个不同的物体类别。
- classes = ['Chair', 'Sofa']: 该列表包含模型将被训练识别的类别或对象的名称。列表中的每个元素都对应一个特定的类标签。这些类别被定义为 "椅子 "和 "沙发",模型将在此基础上训练分割属于这些类别的对象。
import yaml
import os
file_dict = {
    'train': os.path.join(dataDir, 'train'),
    'val': os.path.join(dataDir, 'val'),
    'test': os.path.join(dataDir, 'test'),
    'nc': num_classes,
    'names': classes
}
with open(os.path.join(workingDir, 'data.yaml'), 'w+') as f:
  yaml.dump(file_dict, f)
- file_dict: 创建包含数据集信息的字典:
- train"、"val "和 "test": 分别指向训练、验证和测试数据目录的路径。这些路径由 dataDir(包含数据集的目录)和相应的目录名连接而成。
- nc": 数据集中的类数,由变量 num_classes 表示。
- names':类名列表,由变量 num_classes 表示: 类名列表,由变量 classes 表示。
- with open(...) as f:: 以写模式('w+')打开名为'data.yaml'的文件。如果文件不存在,则将创建该文件。with 语句确保文件在写入后被正确关闭。
- yaml.dump(file_dict, f): yaml.dump() 函数将 Python 对象序列化为 YAML 格式并写入指定的文件对象。
model = YOLO('yolov9c-seg.pt')'yolov9c-seg.pt')
model.train(data='/content/data.yaml' , epochs=30 , imgsz=640)
使用指定的预训练权重文件 "yolov9c-seg.pt "初始化用于对象分割的 YOLOv9 模型。然后在数据参数指定的自定义数据集上训练模型,数据参数指向 YAML 文件 "data.yaml",该文件包含数据集配置细节,如训练和验证图像的路径、类的数量和类的名称。
步骤 5 加载自定义模型
best_model_path = '/content/runs/segment/train/weights/best.pt'
best_model = YOLO(best_model_path)
我们要定义的是训练过程中获得的最佳模型的路径。best_model_path 变量保存了存储最佳模型权重的文件路径。这些权重代表了 YOLOv9 模型的学习参数,该模型在训练数据中取得了最高性能。
接下来,我们使用 best_model_path 作为参数实例化 YOLO 对象。这样就创建了一个 YOLO 模型实例,并使用训练过程中获得的最佳模型的权重进行初始化。这个实例化的 YOLO 模型被称为 best_model,现在可以用于对新数据进行预测。
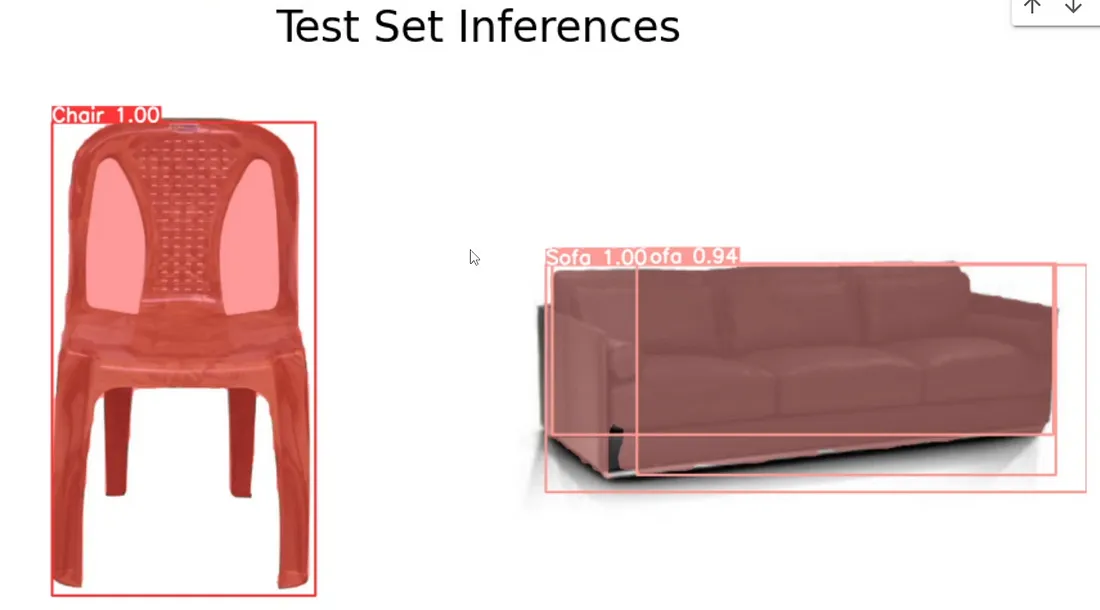
步骤 6 对测试图像进行推理
# Define the path to the validation images
valid_images_path = os.path.join(dataDir, 'test', 'images')
# List all jpg images in the directory
image_files = [file for file in os.listdir(valid_images_path) if file.endswith('.jpg')]
# Select images at equal intervals
num_images = len(image_files)
selected_images = [image_files[i] for i in range(0, num_images, num_images // 4)]
# Initialize the subplot
fig, axes = plt.subplots(2, 2, figsize=(10, 10))
fig.suptitle('Test Set Inferences', fontsize=24)
# Perform inference on each selected image and display it
for i, ax in enumerate(axes.flatten()):
    image_path = os.path.join(valid_images_path, selected_images[i])
    results = best_model.predict(source=image_path, imgsz=640)
    annotated_image = results[0].plot()
    annotated_image_rgb = cv2.cvtColor(annotated_image, cv2.COLOR_BGR2RGB)
    ax.imshow(annotated_image_rgb)
    ax.axis('off')
plt.tight_layout()
plt.show()
- 定义验证图像的路径: 这一行将创建 dataDir 目录中包含测试图像的目录路径。
- 列出目录中的所有 jpg 图像: 它将创建指定目录中所有 JPEG 图像文件的列表。
- 以相同间隔选择图像: 它从列表中选择一个图像子集进行可视化。在这种情况下,它会选择图像总数的四分之一。
- 初始化子绘图: 该行创建一个 2x2 网格的子图来显示所选图像及其相应的预测结果。
- 对每个选定图像进行推理并显示: 该行遍历每个子图,使用 best_model.predict() 函数对相应的选定图像执行推理,并显示带有边界框或分割掩码的注释图像。
- 最后,使用 plt.tight_layout() 将子图整齐排列,并使用 plt.show() 显示。


