如何检测视觉异常
异常检测(AD)在欺诈检测、网络安全和医疗诊断等关键任务应用中至关重要。图像、视频和卫星图像等可视数据的异常检测尤其具有挑战性,因为数据的维度很高,底层模式也很复杂。然而,视觉异常检测对于检测制造过程中的缺陷、识别监控录像中的可疑活动以及检测医疗图像中的异常情况至关重要。
在本文中,你将学习如何使用 OpenVINO 工具包中的 FiftyOne 和 Anomalib 对可视数据执行异常检测。为了进行演示,我们将使用 MVTec AD 数据集,该数据集包含带有划痕、凹痕和孔洞等异常的各种物体的图像。
它包括以下内容:
- 在 FiftyOne 中加载 MVTec AD 数据集
- 使用 Anomalib 训练异常检测模型
- 评估 FiftyOne 中的异常检测模型
设置
安装依赖项
确保在 python=3.10 的虚拟环境中运行。Anomalib 需要 Python 3.10,因此请确保安装了正确的版本。
conda create -n anomalib_env python=3.10
conda activate anomalib_env
之后,根据 Anomalib README 中的说明从源代码安装 Anomalib 及其依赖项。在 Google Colab 上安装可能需要一些时间,但在本地安装应该很快:
pip install -U torchvision einops FrEIA timm open_clip_torch imgaug lightning kornia openvino git+https://github.com/openvinotoolkit/anomalib.git从源代码安装 FiftyOne,以便使用最新版本的 Hugging Face Hub 集成来加载 MVTec AD 数据集:
pip install -U git+https://github.com/voxel51/fiftyone.git只需安装几个软件包,我们就可以开始了。现在你可以明白为什么我们建议在这个项目中使用虚拟环境了!
- huggingface_hub 用于加载 MVTec AD 数据集
- 用于计算图像嵌入的 clip
- 用于降维的 umap-learn
pip install -U huggingface_hub umap-learn git+https://github.com/openai/CLIP.git加载和可视化 MVTec AD 数据集
现在,让我们从 FiftyOne 导入我们需要的所有相关模块:
import fiftyone as fo # base library and app
import fiftyone.brain as fob # ML methods
import fiftyone.zoo as foz # zoo datasets and models
from fiftyone import ViewField as F # helper for defining views
import fiftyone.utils.huggingface as fouh # Hugging Face integration
并从 "Hugging Face Hub "枢纽加载 MVTec AD 数据集:
dataset = fouh.load_from_hub("Voxel51/mvtec-ad", persistent=True, overwrite=True)在继续之前,让我们来看看 FiftyOne 应用程序中的数据集:
session = fo.launch_app(dataset)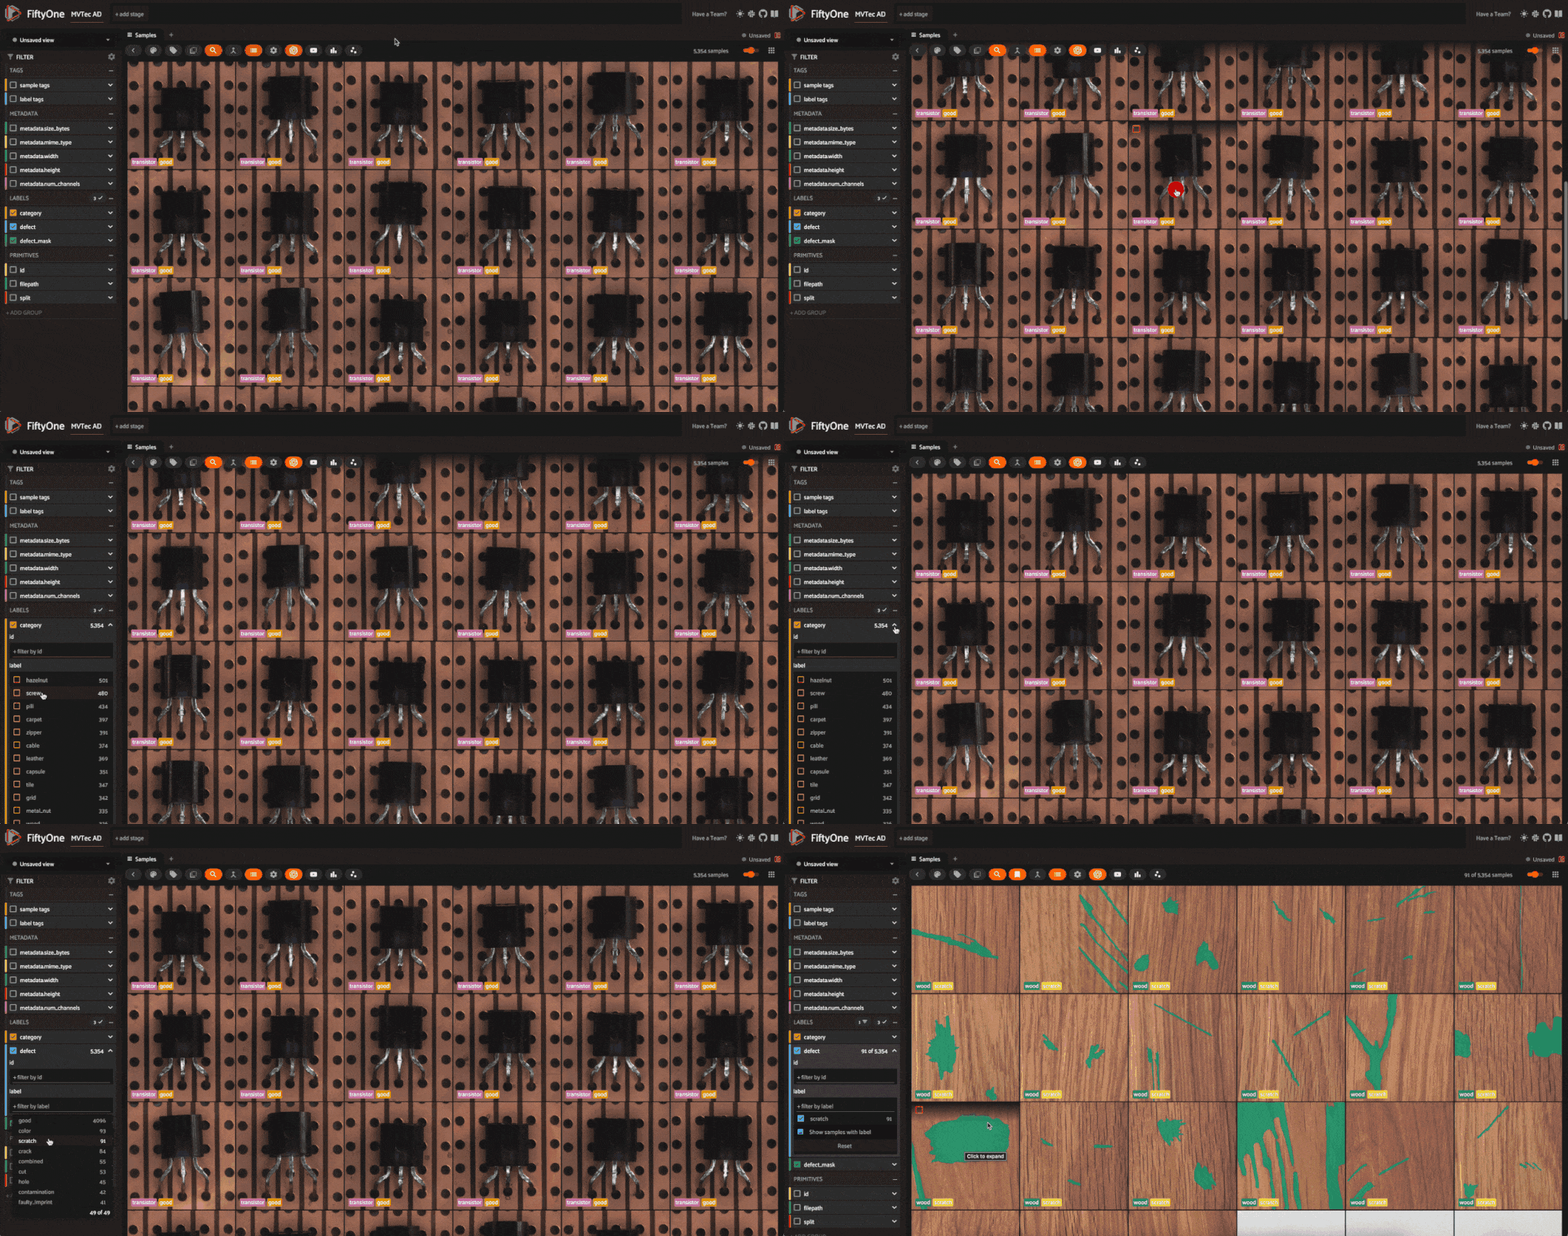
该数据集包含 12 个物体类别的 5354 幅图像。每个类别都有 "良好 "和 "异常 "图像,这些图像都有划痕、凹痕和孔洞等缺陷。每个异常样本都有一个掩码,用于定位图像中的缺陷区域。
不同类别的缺陷标签各不相同,这在现实世界的异常检测场景中非常典型。在这些场景中,你需要为每个类别训练不同的模型。在此,我们将介绍一个类别的过程,你也可以将相同的步骤应用于其他类别。
还需要注意的一点是,数据集分为训练集和测试集。训练集只包含 "好 "图像,而测试集则包含 "好 "和 "异常 "图像。
在训练模型之前,我们先来深入研究一下数据集。我们可以通过计算图像嵌入并将其在低维空间中可视化来了解隐藏在数据中的结构和模式。首先,我们将使用 CLIP 模型计算数据集中所有图像的嵌入:
model = foz.load_zoo_model("clip-vit-base32-torch")  # load the CLIP model from the zoo
# Compute embeddings for the dataset
dataset.compute_embeddings(
    model=model, embeddings_field="clip_embeddings", batch_size=64
)
# Dimensionality reduction using UMAP on the embeddings
fob.compute_visualization(
    dataset, embeddings="clip_embeddings", method="umap", brain_key="clip_vis"
)
刷新 FiftyOne App,单击 "+"选项卡,然后选择 "嵌入"。从下拉菜单中选择 "all_clip_vis"。你会看到图像嵌入在二维空间中的散点图,其中每个点都对应数据集中的一个样本。
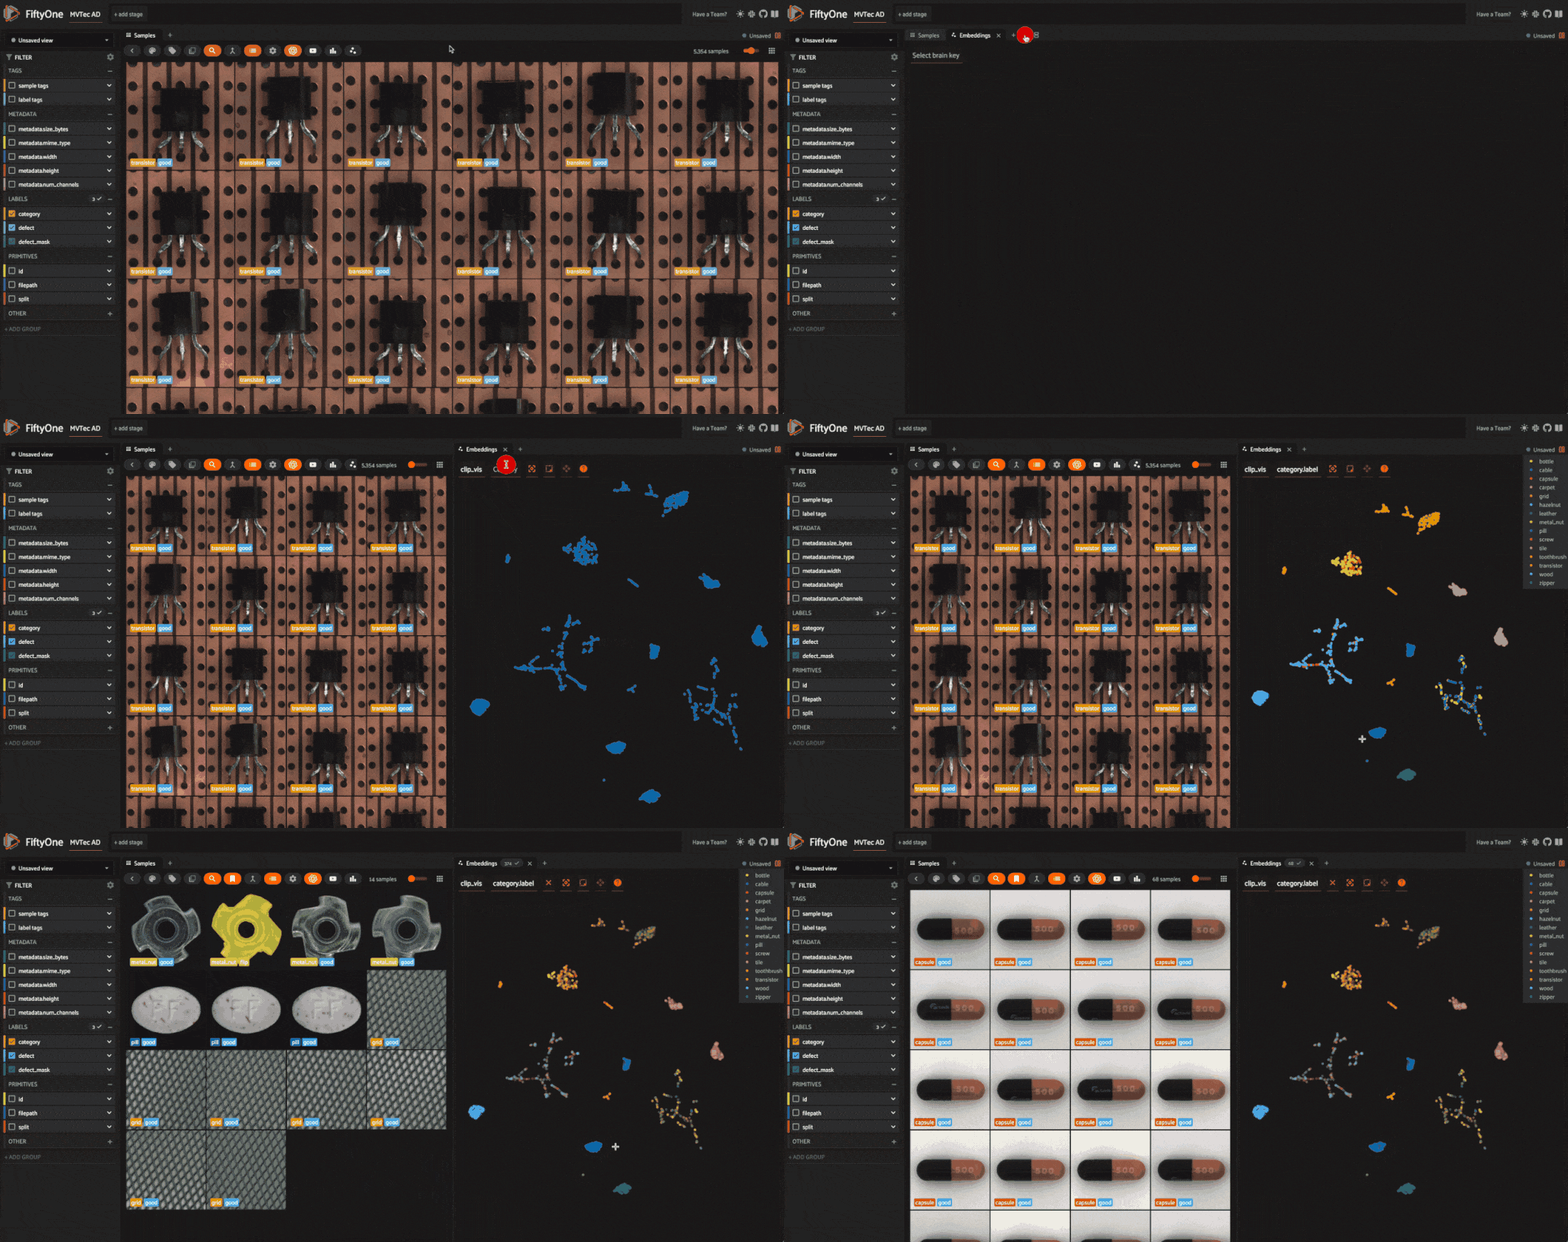
使用 "按颜色 "下拉菜单,注意嵌入是如何根据对象类别进行聚类的。这是因为 CLIP 对图像的语义信息进行了编码。此外,CLIP 嵌入不会根据缺陷类型在类别内聚类。
训练异常检测模型
现在我们对数据集有了一定的了解,可以使用 Anomalib 训练异常检测模型了。
任务: Anomalib 支持图像分类、检测和分割任务。我们将重点关注分割,在分割过程中,模型会预测图像中的每个像素是否异常,并创建一个掩码来定位缺陷。
模型: Anomalib 支持多种异常检测算法。在本教程中,我们将使用两种算法:
- PaDiM:用于异常检测和定位的补丁分布建模框架
- PatchCore: 在工业异常检测中实现总召回
预处理: 在训练模型之前,我们将把图像调整为 256x256 像素。通过 Torchvision 的 "调整大小"(Resize)类将其添加为变换,可让我们在训练和推理过程中即时调整图像大小。
从 Anomalib 中导入必要的模块以及处理图像和路径的辅助模块:
import numpy as np
import os
from pathlib import Path
from PIL import Image
from torchvision.transforms.v2 import Resize
from anomalib import TaskType
from anomalib.data.image.folder import Folder
from anomalib.deploy import ExportType, OpenVINOInferencer
from anomalib.engine import Engine
from anomalib.models import Padim, Patchcore
现在,定义一些在整个笔记本中使用的常量。
- OBJECT(对象): 我们要关注的对象类别。在本练习中,我们将使用 "瓶子"。如果想循环查看类别,可以使用 dataset.distinct("category.label")从数据集中获取类别列表。
- ROOT_DIR:Anomalib 查找图像和掩码的根目录。我们的数据已经存储在磁盘上,因此我们只需将文件链接到 Anomalib 期望的目录即可。
- TASK:我们要执行的任务。我们将使用 "分割 "来进行演示。
- IMAGE_SIZE:训练模型前要调整图像大小的尺寸。我们将使用 256x 256 像素。
OBJECT = "bottle" ## object to train on
ROOT_DIR = Path("/tmp/mvtec_ad") ## root directory to store data for anomalib
TASK = TaskType.SEGMENTATION ## task type for the model
IMAGE_SIZE = (256, 256) ## preprocess image size for uniformity
对于给定的对象类型(类别),下面的 create_datamodule() 函数会创建一个 Anomalib DataModule 对象。该对象将被传递到引擎的 fit()method 中以训练模型,并用于实例化数据加载器以进行训练和验证。
代码看起来可能很复杂,让我们来分解一下:
- 我们创建数据子集,其中只包含 "好的 "训练图像和用于验证的 "异常 "图像。
- 我们将图像和掩码链接到 Anomalib 期望的目录。
- 我们从 Anomalib 的 Folder 中实例化并设置一个数据模块,这是用于自定义数据集的通用类。
也可以从头开始创建一个火炬数据加载器,并将其传递给引擎的 fit() 方法。这样就可以对数据加载过程进行更多控制。
def create_datamodule(object_type, transform=None):
    ## Build transform
    if transform is None:
        transform = Resize(IMAGE_SIZE, antialias=True)
    normal_data = dataset.match(F("category.label") == object_type).match(
        F("split") == "train"
    )
    abnormal_data = (
        dataset.match(F("category.label") == object_type)
        .match(F("split") == "test")
        .match(F("defect.label") != "good")
    )
    normal_dir = Path(ROOT_DIR) / object_type / "normal"
    abnormal_dir = ROOT_DIR / object_type / "abnormal"
    mask_dir = ROOT_DIR / object_type / "mask"
    # create directories if they do not exist
    os.makedirs(normal_dir, exist_ok=True)
    os.makedirs(abnormal_dir, exist_ok=True)
    os.makedirs(mask_dir, exist_ok=True)
    if not os.path.exists(str(normal_dir)):
        normal_data.export(
            export_dir=str(normal_dir),
            dataset_type=fo.types.ImageDirectory,
            export_media="symlink",
        )
    for sample in abnormal_data.iter_samples():
        base_filename = sample.filename
        dir_name = os.path.dirname(sample.filepath).split("/")[-1]
        new_filename = f"{dir_name}_{base_filename}"
        if not os.path.exists(str(abnormal_dir / new_filename)):
            ## symlink anomalous image into Anomalib abnormal dir
            os.symlink(sample.filepath, str(abnormal_dir / new_filename))


        if not os.path.exists(str(mask_dir / new_filename)):
            ## symlink mask into Anomalib mask dir
            os.symlink(sample.defect_mask.mask_path, str(mask_dir / new_filename))

    ## Create a DataModule in Anomalib
    datamodule = Folder(
        name=object_type,
        root=ROOT_DIR,
        normal_dir=normal_dir,
        abnormal_dir=abnormal_dir,
        mask_dir=mask_dir,
        task=TASK,
        transform=transform
    )
    datamodule.setup()
    return datamodule
现在,我们可以将这一切整合在一起。下面的 train_and_export_model() 函数使用 Anomalib 的 Engine 类训练异常检测模型,将模型导出到 OpenVINO,并返回模型的 "inferencer "对象。推论器对象用于对新图像进行预测。
def train_and_export_model(object_type, model, transform=None):
    ## Train model on our data
    datamodule = create_datamodule(object_type, transform=transform)
    engine = Engine(task=TASK)
    engine.fit(model=model, datamodule=datamodule)

    ## Export model into OpenVINO format for fast inference
    engine.export(
        model=model,
        export_type=ExportType.OPENVINO,
    )
    output_path = Path(engine.trainer.default_root_dir)
    openvino_model_path = output_path / "weights" / "openvino" / "model.bin"
    metadata = output_path / "weights" / "openvino" / "metadata.json"

    ## Load the inference object from export
    inferencer = OpenVINOInferencer(
        path=openvino_model_path,
        metadata=metadata,
        device="CPU",
    )
    return inferencer
让我们先用 PaDiM 试试。训练过程应该不超过一分钟:
model = Padim()
inferencer = train_and_export_model(OBJECT, model)
就这样,我们就有了一个针对 "瓶子 "类别训练的异常检测模型。让我们在单张图片上运行我们的推理器并检查结果:
## get the test split of the dataset
test_split = dataset.match(F("category.label") == OBJECT).match(F("split") == "test")
## get the first sample from the test split
test_image = Image.open(test_split.first().filepath)
output = inferencer.predict(image=test_image)
print(output)
ImageResult(image=[[[255 255 255]
  [255 255 255]
  [255 255 255]
  ...
  [255 255 255]
  [255 255 255]
  [255 255 255]]
  ...
  [255 255 255]
  [255 255 255]
  [255 255 255]]], pred_score=0.7751642969087686, pred_label=1, anomaly_map=[[0.32784402 0.32784402 0.32784414 ... 0.3314721  0.33147204 0.33147204]
 [0.32784402 0.32784402 0.32784414 ... 0.3314721  0.33147204 0.33147204]
 [0.32784408 0.32784408 0.3278442  ... 0.33147222 0.33147216 0.33147216]
 ...
 [0.32959    0.32959    0.32959005 ... 0.3336093  0.3336093  0.3336093 ]
 [0.3295899  0.3295899  0.32958996 ... 0.33360928 0.33360928 0.33360928]
 [0.3295899  0.3295899  0.32958996 ... 0.33360928 0.33360928 0.33360928]], gt_mask=None, gt_boxes=None, pred_boxes=None, box_labels=None, pred_mask=[[0 0 0 ... 0 0 0]
 [0 0 0 ... 0 0 0]
 [0 0 0 ... 0 0 0]
 ...
 [0 0 0 ... 0 0 0]
 [0 0 0 ... 0 0 0]
 [0 0 0 ... 0 0 0]], heat_map=[[[153 235 255]
  [153 235 255]
  [153 235 255]
  ...
  [153 236 255]
  [153 236 255]
  [153 236 255]]
  ...
  [153 238 255]
  [153 238 255]
  [153 238 255]]], segmentations=[[[255 255 255]
  [255 255 255]
  [255 255 255]
  ...
  [255 255 255]
  [255 255 255]
  [255 255 255]]
  ...
  [255 255 255]
  [255 255 255]
  [255 255 255]]])
输出结果包含一个标量异常分数 pred_score、一个表示预测异常区域的 pred_mask,以及一个显示每个像素异常分数的热图 anomaly_map。这些都是了解模型预测结果的宝贵信息。
下面的 run_inference()函数会将 FiftyOne 样本集合(例如我们的测试集)作为输入,同时输入推理对象和用于在样本中存储结果的密钥。它将在样本集中的每个样本上运行模型并存储结果。阈值参数是异常得分的分界线。如果得分高于阈值,样本就会被视为异常。在本例中,我们使用的阈值是 0.5,但你也可以尝试使用不同的值。
def run_inference(sample_collection, inferencer, key, threshold=0.5):
    for sample in sample_collection.iter_samples(autosave=True, progress=True):
        output = inferencer.predict(image=Image.open(sample.filepath))

        conf = output.pred_score
        anomaly = "normal" if conf < threshold else "anomaly"
        sample[f"pred_anomaly_score_{key}"] = conf
        sample[f"pred_anomaly_{key}"] = fo.Classification(label=anomaly)
        sample[f"pred_anomaly_map_{key}"] = fo.Heatmap(map=output.anomaly_map)
        sample[f"pred_defect_mask_{key}"] = fo.Segmentation(mask=output.pred_mask)
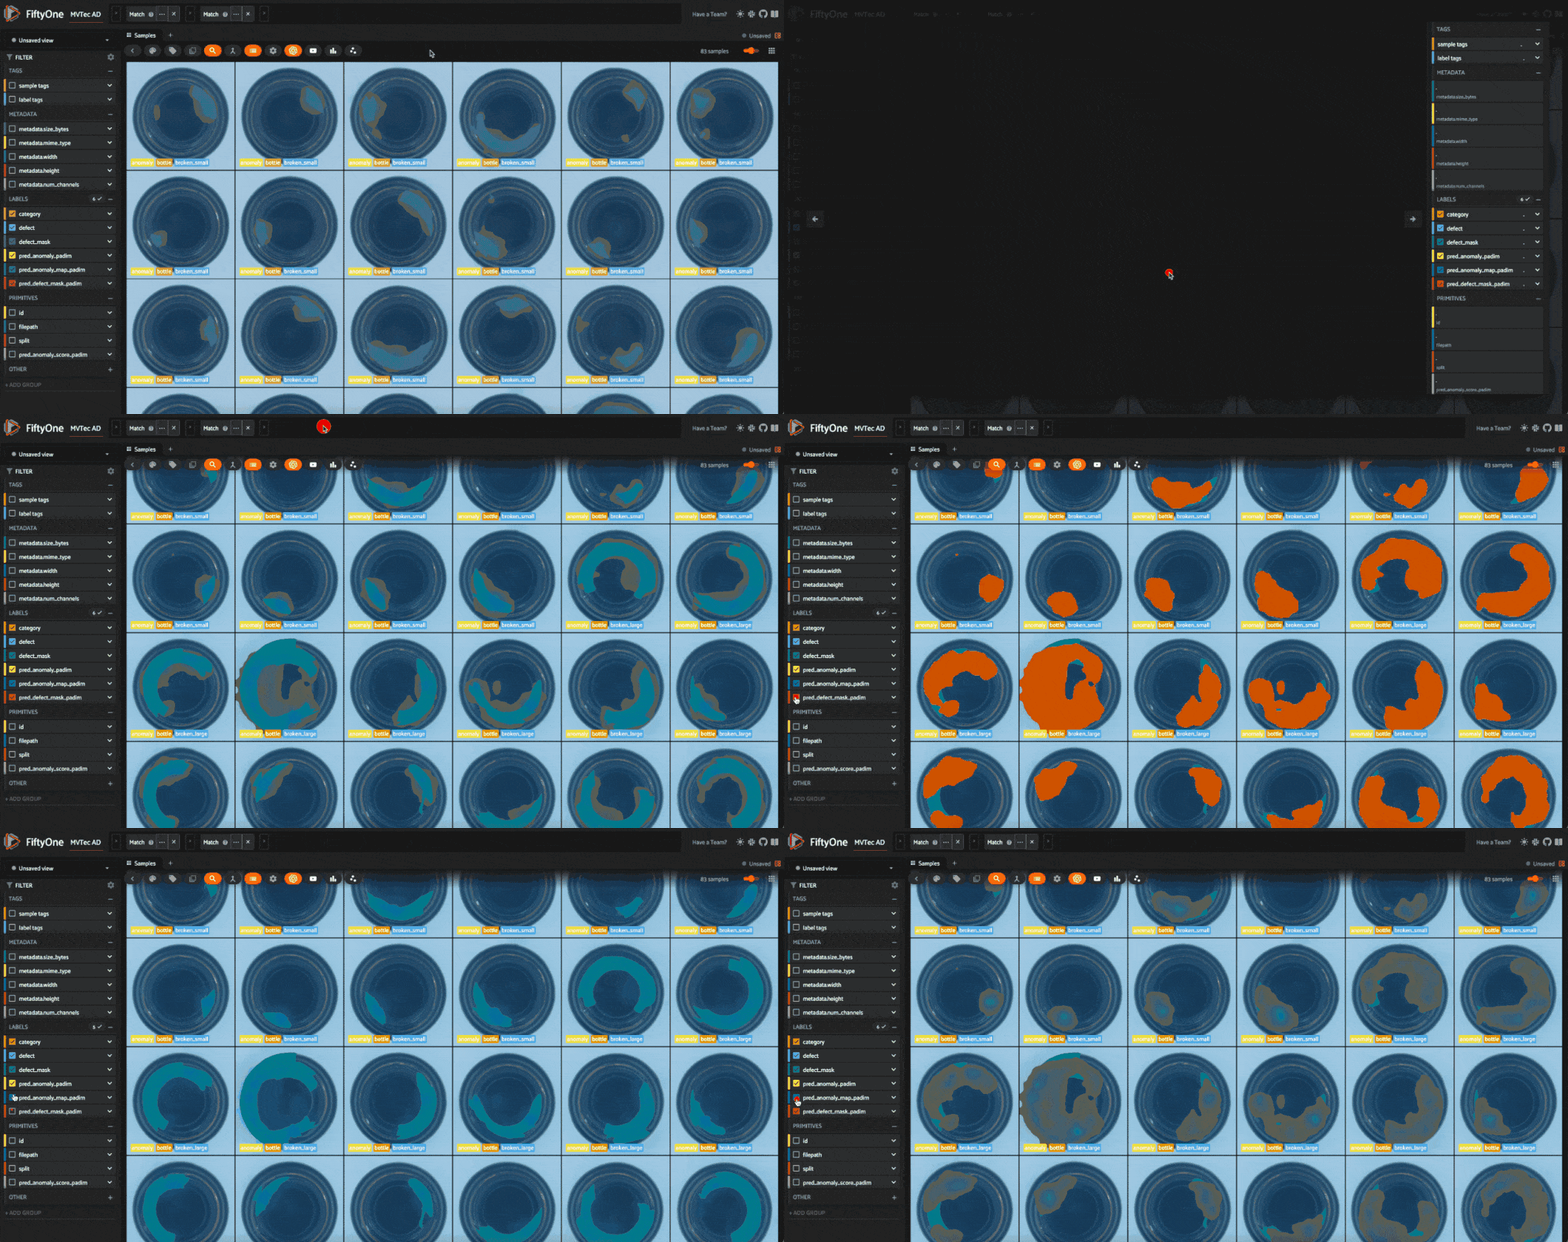
让我们在 FiftyOne 应用程序中对测试结果进行推理,并将结果可视化:
run_inference(test_split, inferencer, "padim")
session = fo.launch_app(view=test_split)
评估异常检测模型
我们有了异常检测模型,但如何知道它是否优秀呢?首先,我们可以使用精确度、召回率和 F1 分数指标来评估模型。FiftyOne 的评估 API 可以轻松实现这一点。我们将评估模型的全图分类性能以及分割性能。
我们需要为评估准备数据。首先,我们需要为 "正常 "图像添加空掩码,以确保评估的公平性:
for sample in test_split.iter_samples(autosave=True, progress=True):
    if sample["defect"].label == "good":
        sample["defect_mask"] = fo.Segmentation(
            mask=np.zeros_like(sample["pred_defect_mask_padim"].mask)
        )
我们还需要确保地面实况和预测结果在命名/标签方面的一致性。我们将把所有 "良好 "图像重命名为 "正常",把所有异常类型重命名为 "异常":
old_labels = test_split.distinct("defect.label")
label_map = {label:"anomaly" for label in old_labels if label != "good"}
label_map["good"] = "normal"
mapped_view = test_split.map_labels("defect", label_map)
session.view = mapped_view.view()
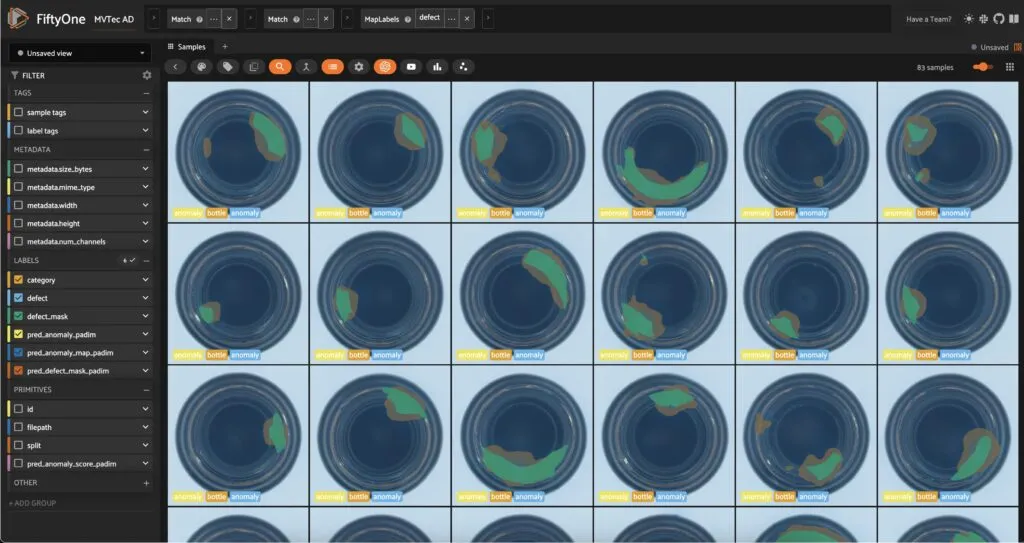
在分类方面,我们将使用二元评价法,将 "正常 "作为负类,将 "异常 "作为正类:
eval_classif_padim = mapped_view.evaluate_classifications(
    "pred_anomaly_padim",
    gt_field="defect",
    eval_key="eval_classif_padim",
    method="binary",
    classes=["normal", "anomaly"],
)
eval_classif_padim.print_report()
             precision    recall  f1-score   support
      normal       0.95      0.90      0.92        20
     anomaly       0.97      0.98      0.98        63
    accuracy                           0.96        83
   macro avg       0.96      0.94      0.95        83
weighted avg       0.96      0.96      0.96        83
该模型在分类任务中表现相当出色。如果我们回到应用程序并按异常得分进行排序,就会发现某些异常的得分往往高于其他异常。在本例中,相对于 broken_small 和 broken_large,污染实例的得分往往很高或很低。当我们将此模型投入生产时,可能会更容易错过某些异常情况。其他模型或模型集合可能对此更有把握!
对于分割评估,我们只对像素值为 0(正常)和 255(异常)的像素感兴趣,因此我们将过滤这些 "类别 "的报告:
eval_seg_padim = mapped_view.evaluate_segmentations(
    "pred_defect_mask_padim",
    gt_field="defect_mask",
    eval_key="eval_seg_padim",
)
eval_seg_padim.print_report(classes=[0, 255])
precision    recall  f1-score   support
           0       0.99      0.96      0.98 63343269.0
         255       0.60      0.89      0.72 3886731.0
   micro avg       0.96      0.96      0.96 67230000.0
   macro avg       0.80      0.93      0.85 67230000.0
weighted avg       0.97      0.96      0.96 67230000.0
比较异常检测模型
异常检测是无监督的,但这并不意味着我们不能对模型进行比较,并选择最适合我们用例的模型。我们可以在相同数据上训练多个模型,并使用 F1 分数、精确度和召回率等指标来比较它们的性能。我们还可以通过检查模型生成的掩码和热图来直观地比较模型。
让我们重复 PatchCore 模型的训练过程,并比较这两个模型:
## Train Patchcore model and run inference
model = Patchcore()
## This will take a little longer to train, but should still be < 5 minutes
inferencer = train_and_export_model(OBJECT, model)
run_inference(mapped_view, inferencer, "patchcore")
## Evaluate Patchcore model on classification task
eval_classif_patchcore = mapped_view.evaluate_classifications(
    "pred_anomaly_patchcore",
    gt_field="defect",
    eval_key="eval_classif_patchcore",
    method="binary",
    classes=["normal", "anomaly"],
)
eval_classif_patchcore.print_report()
               precision    recall  f1-score   support
      normal       0.95      1.00      0.98        20
     anomaly       1.00      0.98      0.99        63
    accuracy                           0.99        83
   macro avg       0.98      0.99      0.98        83
weighted avg       0.99      0.99      0.99        83
eval_seg_patchcore = mapped_view.match(F("defect.label") == "anomaly").evaluate_segmentations(
    "pred_defect_mask_patchcore",
    gt_field="defect_mask",
    eval_key="eval_seg_patchcore",
)
eval_seg_patchcore.print_report(classes=[0, 255])
session.view = mapped_view.shuffle().view()
      precision    recall  f1-score   support
           0       0.99      0.95      0.97 47143269.0
         255       0.60      0.85      0.70 3886731.0
   micro avg       0.95      0.95      0.95 51030000.0
   macro avg       0.80      0.90      0.84 51030000.0
weighted avg       0.96      0.95      0.95 51030000.0
这些指标证明了我们在应用程序中看到的结果: PatchCore 的 "异常 "类召回率更高,但准确率较低。这意味着它更有可能捕捉到异常,但也更有可能做出误报预测。毕竟,PatchCore 是为工业异常检测中的 "总召回率 "而设计的。
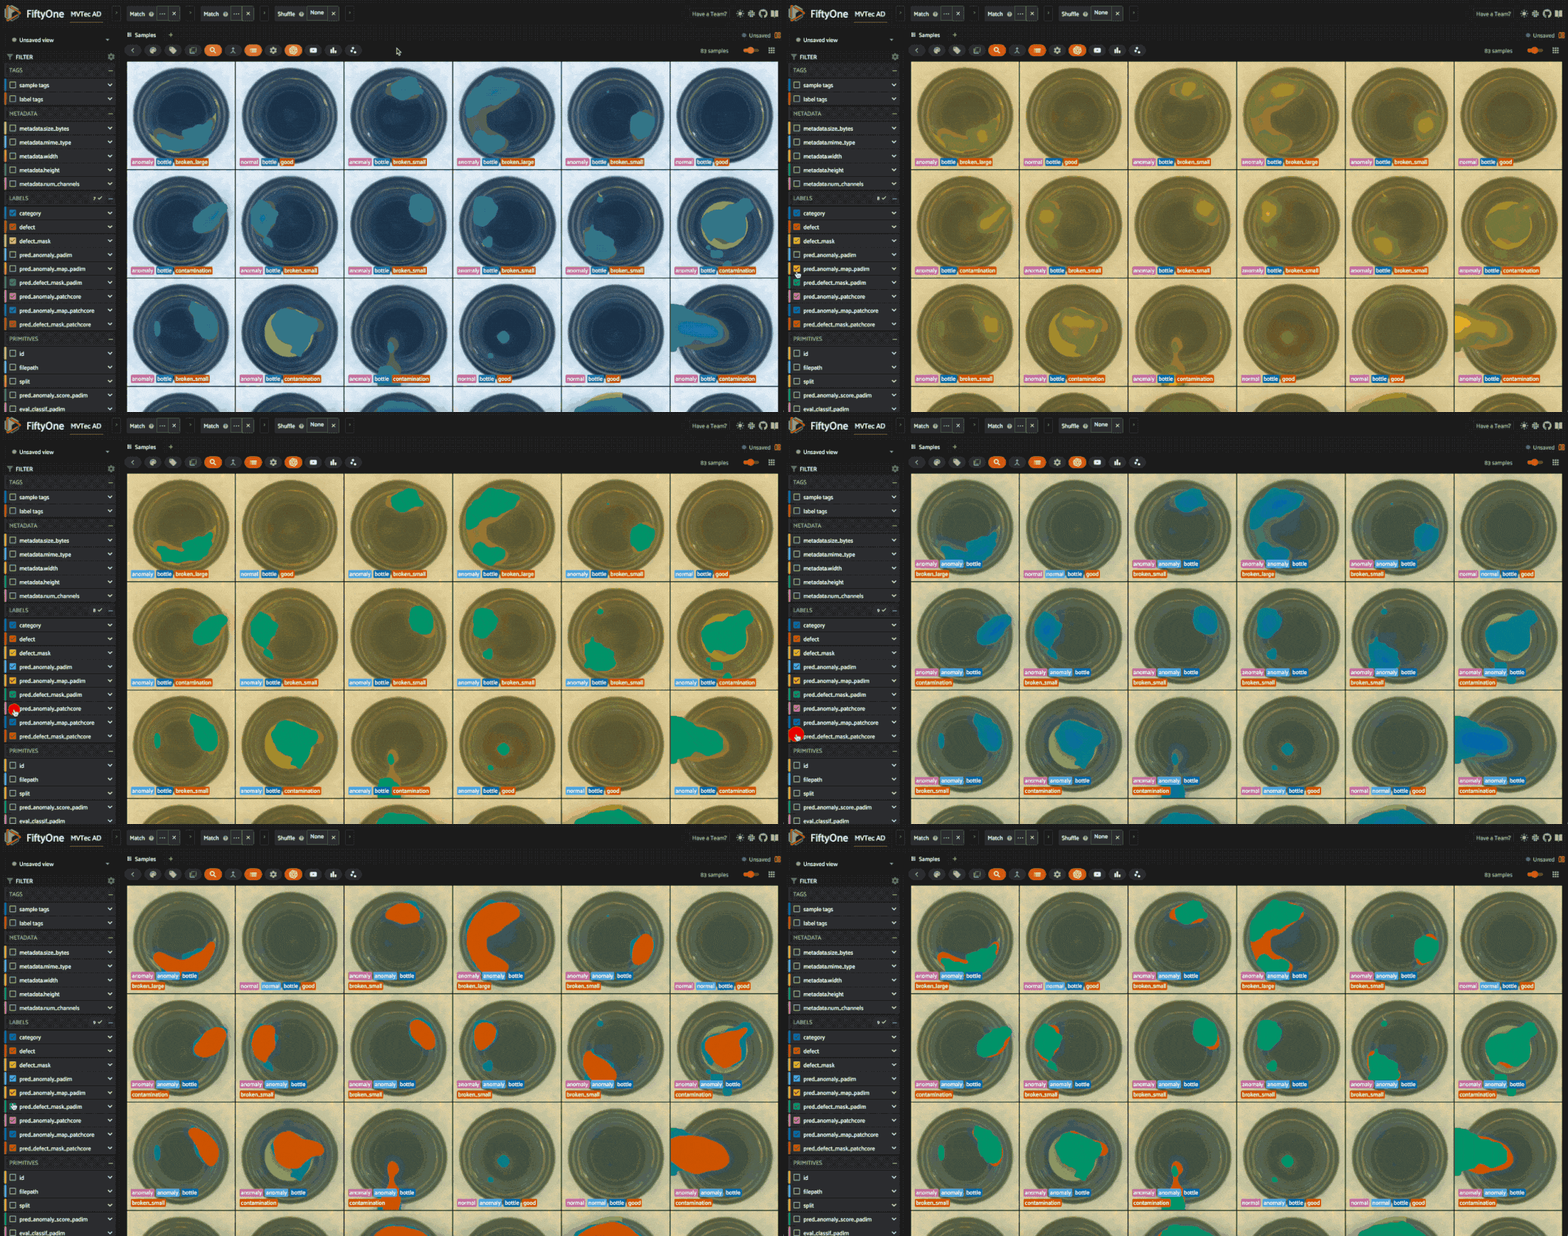
通过热图,我们还可以看到每个模型更擅长检测哪些类型的异常。这两种模型的集合可能对不同类型的异常现象更加稳健。
总结
在本文中,我们学习了如何使用 FiftyOne 和 Anomalib 对可视数据进行异常检测。虽然我们训练了两个模型,但我们仅仅触及了可视化异常检测的表面。


