使用MLForecast进行时间序列数据预测
时间序列预测不再只是统计算法的领域。传统的机器学习模型已经在时间序列预测任务中取得了显著的成功,并且在处理外部指标(促销、折扣、假期等等)时会变得非常重要。
在本文中,我将详细演练并演示如何将其用于时间序列数据。让我们深入研究预测。
MLForecast 库
MLForecast 是 Nixtla 生态系统中的一个功能强大的库,设计用于使用机器学习模型进行时间序列预测。MLForecast 允许用户定义模型、特征(包括滞后期、滞后期变换和日期特征)和目标变换。该库提供了几个关键特性和功能:
- MLForecast 为使用机器学习模型执行时间序列预测提供了一个框架。
- 它可以使用远程集群扩展到海量数据。
- MLForecast 与遵循 scikit-learn API 的模型兼容,因此具有高度灵活性,可与各种机器学习算法无缝集成。
- MLForecast 设计用于快速执行任务,这在处理大型数据集和复杂模型时至关重要。
- 它能够使用 Spark、Dask 和 Ray 等分布式计算框架进行水平扩展。这一特性使它能够通过将计算分配到集群中的多个节点来高效处理海量数据集,是大规模时间序列预测任务的理想选择。
MLForecast 确保高性能和可扩展性
MLForecast 设计用于快速执行任务,这在处理大型数据集和复杂模型时至关重要。
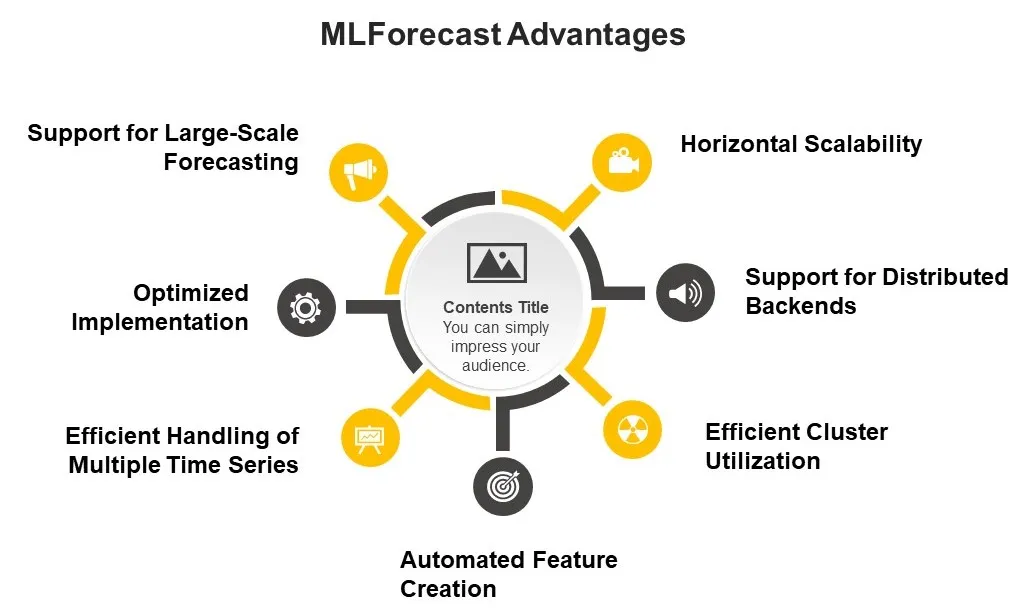
水平可扩展性: MLForecast 能够使用 Spark、Dask 和 Ray 等分布式计算框架进行水平扩展。这一特性使它能够通过将计算分配到集群中的多个节点来高效处理海量数据集,是大规模时间序列预测任务的理想选择。
支持分布式后端: MLForecast 可以根据输入数据类型自动调度到相应的后端:
- 如果你提供的是 pandas 数据帧,它将在本地运行。在此,你可以设置 n_job>1,以便在本地机器上使用多进程。
- 如果提供的是 spark 数据帧,则将在集群中运行。在这种情况下,n_jobs 将自动设置为 1,以避免嵌套并行(spark 在此处理并行)。
高效利用集群: 使用 Spark 时,为了最大限度地提高集群利用率,你应确保至少有与执行器一样多的分区(或它们的倍数),以便 Spark 可以为每个执行器调度至少一个任务。
自动创建特征: MLForecast 可为时间序列预测提供自动特征创建功能,从而大大加快模型开发过程。
高效处理多个时间序列: MLForecast 设计用于高效处理多个时间序列。它对所有序列使用单个(全局)模型,这通常比为每个序列训练单独的模型更快,性能也更好。
优化实现:使用高效的库和算法实现 MLForecast 的核心功能。
支持大规模预测: MLForecast 专为处理大规模预测任务而设计。例如,它可以高效处理包含数百万个时间序列的数据集。值得注意的是,虽然这些功能有助于提高性能和可扩展性,但实际性能将取决于各种因素,包括使用的特定模型、数据集的大小和复杂性以及可用的计算资源。
MLForecast如何预测?
MLForecast默认使用递归策略进行预测。这意味着它一次预测一个步骤,将前一个步骤的预测作为未来步骤的输入。
以下是 MLForecast 如何在每个步骤中执行预测的详细说明:
- 初始设置: 创建 MLForecast 对象时,你需要指定模型、频率、滞后期和其他参数。
- 创建特征:MLForecast 会根据你指定的滞后期和滞后期变换自动创建特征。
- 模型训练: 在拟合过程中,MLForecast 会使用创建的特征在历史数据上训练指定的模型。
- 预测过程: 当你调用预测方法时,它会生成预测。这一步骤将在下一小节详细讨论。
- 处理多个模型: 如果你指定了多个模型,MLForecast 将对每个模型重复预测过程。
- 输出: 最终输出是一个 DataFrame,其中包含每个指定模型在整个预测范围内的预测结果。
MLForecast 中的预测方法在每个预测范围内都遵循以下步骤:
a. 第一步:
- 它使用实际历史数据创建滞后特征。
- 模型使用这些特征对这一步进行预测。
b. 对于后续步骤:
- 它使用历史数据和先前预测值的组合来创建滞后特征。
- 例如,如果你要预测第二步,而滞后期为 1,那么它将使用第一步的预测值作为滞后期 1 的特征。
- 然后,模型会使用这些更新的特征对这一步进行预测。
c. 这一过程以递归方式持续到预测范围内的每一步,始终使用最新的预测结果来更新滞后特征。
值得注意的是,由于每一步的预测都是基于之前的预测值而非实际值,因此这种递归策略可能会导致误差在较长的预测范围内累积。
MLForecast 还支持直接的多步预测方法,即在预测范围内的每一步都训练单独的模型。这可以通过设置拟合方法中的 max_horizon 参数来激活。在这种情况下:
- MLForecast 会为预测范围内的每一步训练单独的模型。
- 在预测时,它会为每一步使用适当的模型,这有可能减少较长周期内的误差累积。
请记住,根据你使用的具体模型和参数,确切的行为可能会有所不同。递归策略是默认的,但你可以根据具体的预测需求灵活调整。
用于 ML 预测的特征生成
MLForecast 可与各种机器学习算法配合使用。与统计算法不同,ML 算法不会自动理解数据的时间依赖性。它依赖于在训练阶段作为输入提供给模型的特征,以了解更多有关时间序列的信息。在本节中,我们将讨论特征生成步骤以及实际应用的示例。
- 滞后期: MLForecast 允许你指定用作回归因子的滞后值。在使用滞后期参数创建 MLForecast 对象时可以定义这些滞后期值。
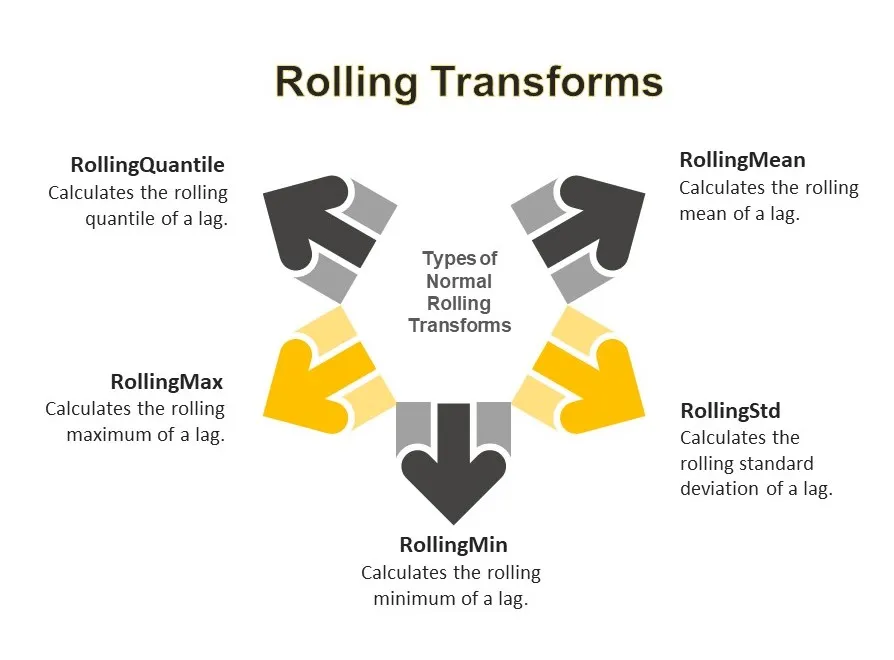
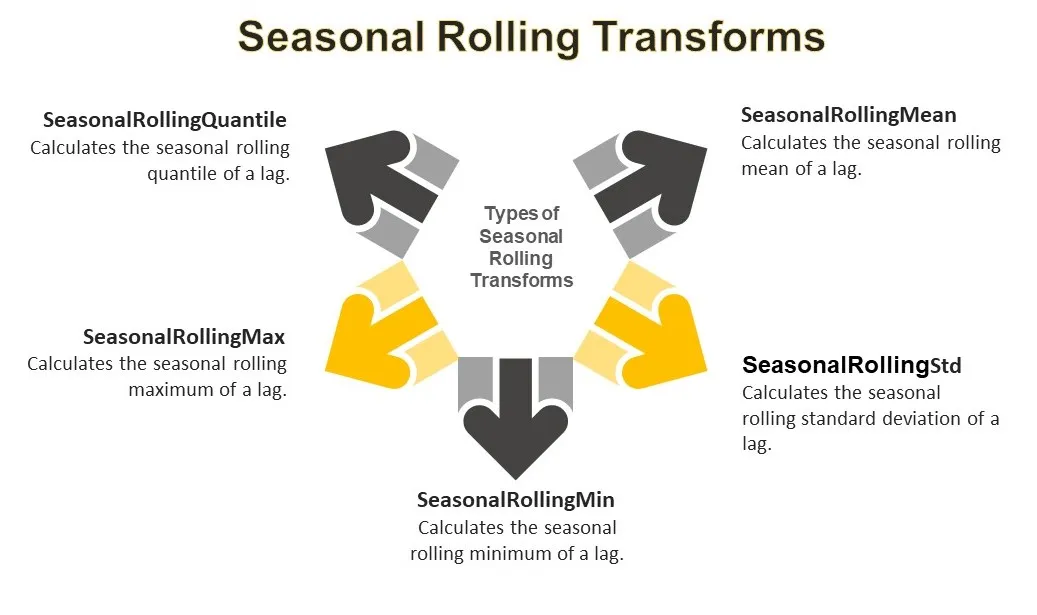
- 滞后变换: MLForecast 还允许你对滞后特征进行变换。这可以使用 lag_transforms 参数来实现。MLForecast 提供多种内置滞后变换,可应用于滞后特征。这些变换可分为三大类:
2.1 滚动变换:
2.2 季节性滚动变换:
2.3. 扩展变换:
- ExpandingMean: 计算滞后点的扩展均值。
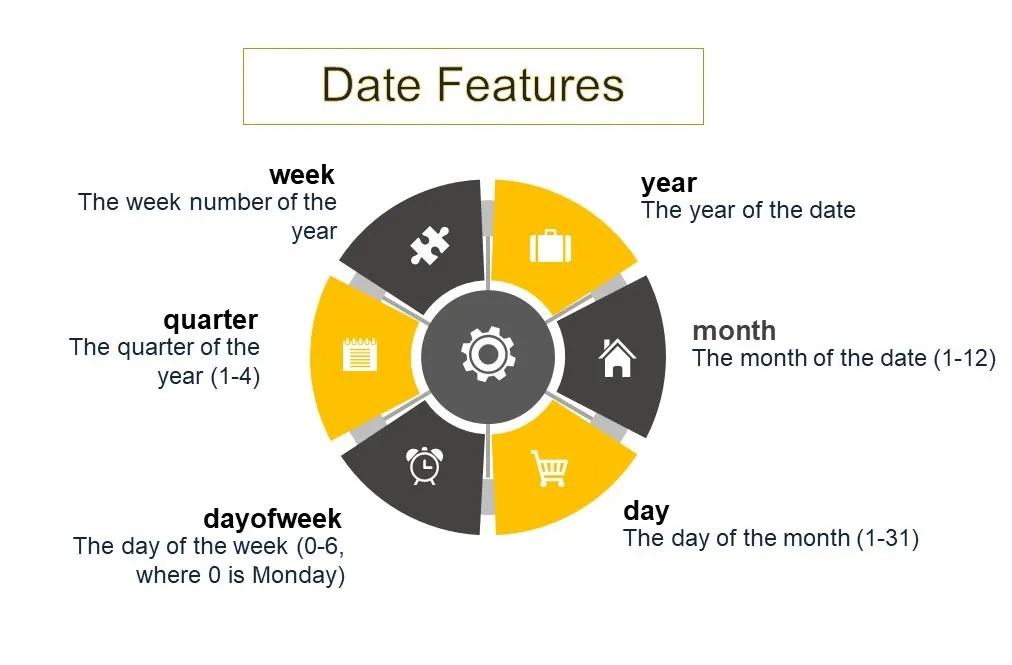
3. 日期特征: 如上例所示,你还可以指定自动生成的日期特征。这些特征由日期计算得出,可包括年、月、日、星期、季度和周等属性。
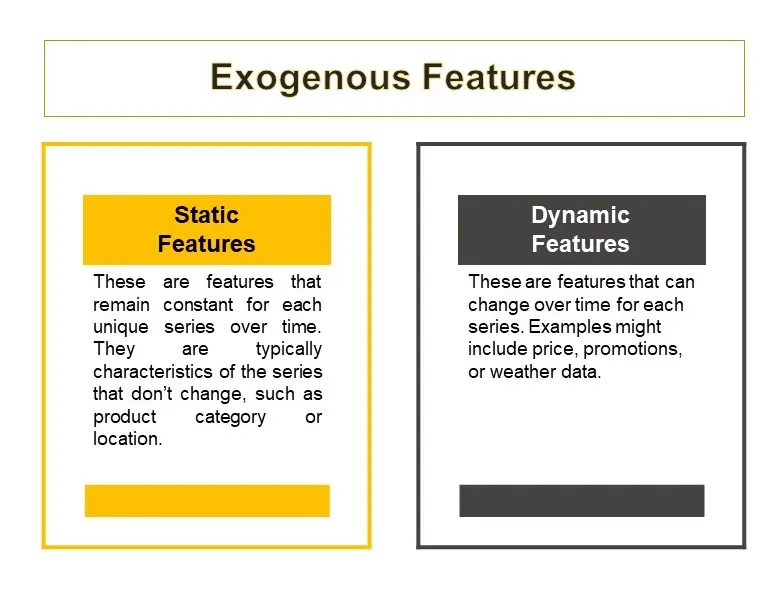
4. 外生特征: MLForecast 支持静态和动态外生特征。你可以使用 transform_exog 函数转换外生特征。
5. 目标变换
MLForecast 中的目标变换在时间序列预测中具有多种重要作用,主要是为了改善模型性能和数据特征。通过去除趋势和稳定方差,这些变换可以帮助实现对许多预测模型至关重要的静态性。它们还有助于归一化、处理非线性关系,并可针对不同类型的数据进行调整。在 MLForecast 中使用目标变换的一个主要优势是在预测过程中自动处理反变换,从而简化预测过程。灵活的连锁多重变换允许采用定制方法来应对各种预测挑战 . 差分(如 “Differences([1])”)等变换通常用于消除趋势,而 “LocalStandardScaler ”等其他变换则可以单独标准化每个序列。变换的选择应基于数据的具体特征和预测任务的要求,通常需要通过实验才能找到最有效的方法。
AutoDifferences 是一种更先进的自动差分方法。它能自动确定适用于数据中每个组(时间序列)的最佳差分次数。它使用统计检验来确定序列是否静止,如果不静止,就会应用差分,直到实现静止或达到最大差分次数。max_diffs 参数设置了可应用的最大差分次数。
例如:
from mlforecast import MLForecast
from coreforecast.scalers import AutoDifferences
import lightgbm as lgb
# Create an MLForecast instance with AutoDifferences
fcst = MLForecast(
    models=[lgb.LGBMRegressor()],
    freq='D',
    lags=[1, 7, 14],
    target_transforms=[AutoDifferences(max_diffs=2)]
)
# Fit the model and make predictions
fcst.fit(train_data)
predictions = fcst.predict(horizon=30)
设置 max_diffs=2 可以让 AutoDifferences 灵活地应用一阶差分或二阶差分,具体取决于每个序列实现平稳性所需的条件。超过二阶差分(即 max_diffs > 2)很少有必要,而且会导致过度差分,从而带来不必要的复杂性,并可能损害预测准确性。
不同时间尺度的特征生成样本
季度数据
from mlforecast import MLForecast
from mlforecast.lag_transforms import RollingMean, ExpandingMean
fcst = MLForecast(
    models=[],  # Add your models here
    freq='Q',   # Quarterly frequency
    lags=[1, 4],  # Lag of 1 quarter and 1 year
    lag_transforms={
        1: [ExpandingMean()],
        4: [RollingMean(window_size=4)]  # Rolling mean over the past year
    },
    date_features=['quarter']
)
月度数据:
fcst = MLForecast(
    models=[],  # Add your models here
    freq='M',   # Monthly frequency
    lags=[1, 12],  # Lag of 1 month and 1 year
    lag_transforms={
        1: [ExpandingMean()],
        12: [RollingMean(window_size=12)]  # Rolling mean over the past year
    },
    date_features=['month']
)
每周数据:
fcst = MLForecast(
    models=[],  # Add your models here
    freq='W',   # Weekly frequency
    lags=[1, 4, 52],  # Lag of 1 week, 1 month, and 1 year
    lag_transforms={
        1: [ExpandingMean()],
        4: [RollingMean(window_size=4)],  # Rolling mean over the past month
        52: [RollingMean(window_size=52)]  # Rolling mean over the past year
    },
    date_features=['week']
)
每天数据:
fcst = MLForecast(
    models=[],  # Add your models here
    freq='D',   # Daily frequency
    lags=[1, 7, 30, 365],  # Lag of 1 day, 1 week, 1 month, and 1 year
    lag_transforms={
        1: [ExpandingMean()],
        7: [RollingMean(window_size=7)],   # Rolling mean over the past week
        30: [RollingMean(window_size=30)], # Rolling mean over the past month
        365: [RollingMean(window_size=365)] # Rolling mean over the past year
    },
    date_features=['dayofweek', 'month']
)
每小时数据:
fcst = MLForecast(
    models=[],  # Add your models here
    freq='H',   # Hourly frequency
    lags=[1, 24, 168, 720],  # Lag of 1 hour, 1 day, 1 week, and 1 month
    lag_transforms={
        1: [ExpandingMean()],
        24: [RollingMean(window_size=24)],   # Rolling mean over the past day
        168: [RollingMean(window_size=168)], # Rolling mean over the past week
        720: [RollingMean(window_size=720)]  # Rolling mean over the past month
    },
    date_features=['hour', 'dayofweek']
)
MLForecast 中使用的预测模型
MLForecast 设计用于与遵循 scikit-learn API 的各种机器学习模型协同工作。其中一些常用模型包括:
- 线性回归: 这是一种基本算法,通常用作基准模型。它包含在 MLForecast 文档中的许多示例中。
- LightGBM:这是一种梯度提升框架,使用基于树的学习算法。其设计旨在提高速度和效率。它使用了一种新颖的树叶生长技术,而不是传统的水平生长技术,从而提高了准确性并减少了过度拟合。它适用于大型数据集,支持并行和 GPU 学习,是高性能机器学习任务的强大工具。
- XGBoost Extreme Gradient Boosting 是一个可扩展的高效梯度提升框架。它使用先进的正则化技术来防止过拟合,并支持并行和分布式计算。XGBoost 以速度和性能著称,被广泛应用于机器学习竞赛和实际应用中,是预测建模和数据分析的热门选择。
- 随机森林 随机森林是一种基于分组的集合学习方法,在训练过程中会构建多棵决策树。它将这些决策树的预测结果合并起来,以提高准确性并控制过拟合。通过平均多棵决策树,它可以提高性能并减少差异。随机森林对嘈杂数据的适应性强,对分类和回归任务有效,因其简单性和强大的预测能力而被广泛使用。
如果你没有找到适合你任务的模型,你也可以编写自己的模型。你也可以编写自己的模型。
以下是如何实现这一目标的分步指南:
首先,你需要创建一个自定义模型类,该类继承自 sklearn.base.BaseEstimator,并实现所需的方法。下面是一个基本结构:
from sklearn.base import BaseEstimator, RegressorMixin
from sklearn.utils.validation import check_X_y, check_array, check_is_fitted
class CustomModel(BaseEstimator, RegressorMixin):
    def __init__(self, param1=1, param2=1):
        self.param1 = param1
        self.param2 = param2
    def fit(self, X, y):
        # Check that X and y have correct shape
        X, y = check_X_y(X, y)
        # Store the classes seen during fit
        self.classes_ = unique_labels(y)

        # Your model fitting logic here

        # Return the classifier
        return self
    def predict(self, X):
        # Check is fit had been called
        check_is_fitted(self)
        # Input validation
        X = check_array(X)

        # Your prediction logic here

        return y_pred
一旦定义了自定义模型,你就可以在 MLForecast 中使用它,就像使用其他与 scikit-learn 兼容的模式一样。
from mlforecast import MLForecast
from your_module import CustomModel
mlf = MLForecast(
    models=[CustomModel()],  # Use your custom model here
    freq='D',  # Frequency of the data - 'D' for daily frequency
    lags=[1, 2, 3],  # Lag features to use
    date_features=['dayofweek', 'month'],  # Date-based features
)
然后,你可以将此 MLForecast 实例与你的自定义模型一起用于拟合和预测,就像使用其他模型一样:
# Fit the model
mlf.fit(df)
# Make predictions
predictions = mlf.predict(horizon=7)
值得注意的是,你的自定义模型至少应实现拟合和预测方法,以便与 MLForecast 1 兼容。 拟合方法应将 X(特征)和 y(目标)作为输入,并返回自身。预测方法应将 X 作为输入并返回预测结果。
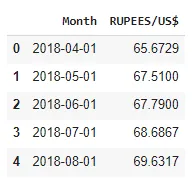
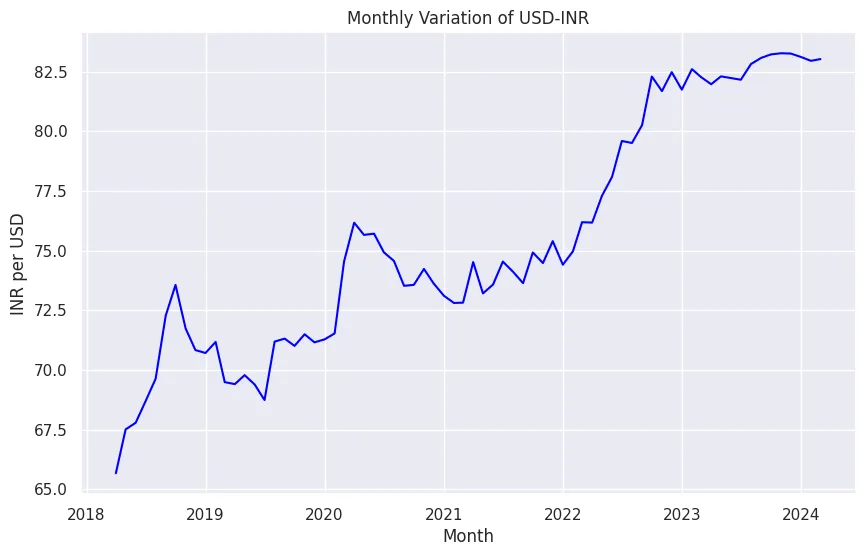
在本实验部分,我们使用的是美元-印度卢比月度换算值(印度卢比/美元)。数据时间段为 2018 年 4 月至 2024 年 3 月。
让我们安装 mlforecast
#This will also install collected packages: window-ops, utilsforecast, mlforecast
!pip install mlforecast
让我们下载所需的程序库
import seaborn as sns
import matplotlib.pyplot as plt
import numpy as np
from mlforecast import MLForecast
from mlforecast.target_transforms import Differences
from numba import njit
import lightgbm as lgb
import xgboost as xgb
from sklearn.linear_model import LinearRegression
from sklearn.ensemble import RandomForestRegressor
from statsmodels.tsa.seasonal import seasonal_decompose
from mlforecast import MLForecast
from mlforecast.lag_transforms import (
    RollingMean, RollingStd, RollingMin, RollingMax, RollingQuantile,
    SeasonalRollingMean, SeasonalRollingStd, SeasonalRollingMin,
    SeasonalRollingMax, SeasonalRollingQuantile,
    ExpandingMean
)
from coreforecast.scalers import AutoDifferences
现在,我们将把数据读入一个数据帧。
file_path = "USD-INR.csv"
df = pd.read_csv(file_path)
df['Month'] = pd.to_datetime(df['Month'])
df = df.set_index('Month').resample('MS').mean()
df = df.interpolate() #to interpolate and fill missing values
df.reset_index(inplace=True)
print(df.head())
让我们将数据可视化。
sns.set(style="darkgrid")
plt.figure(figsize=(10, 6))
sns.lineplot(x="Month", y='RUPEES/US$', data=df, color='bLUE')
plt.title('Monthly Variation of USD-INR')
plt.xlabel('Month')
plt.ylabel('INR per USD')
plt.show()
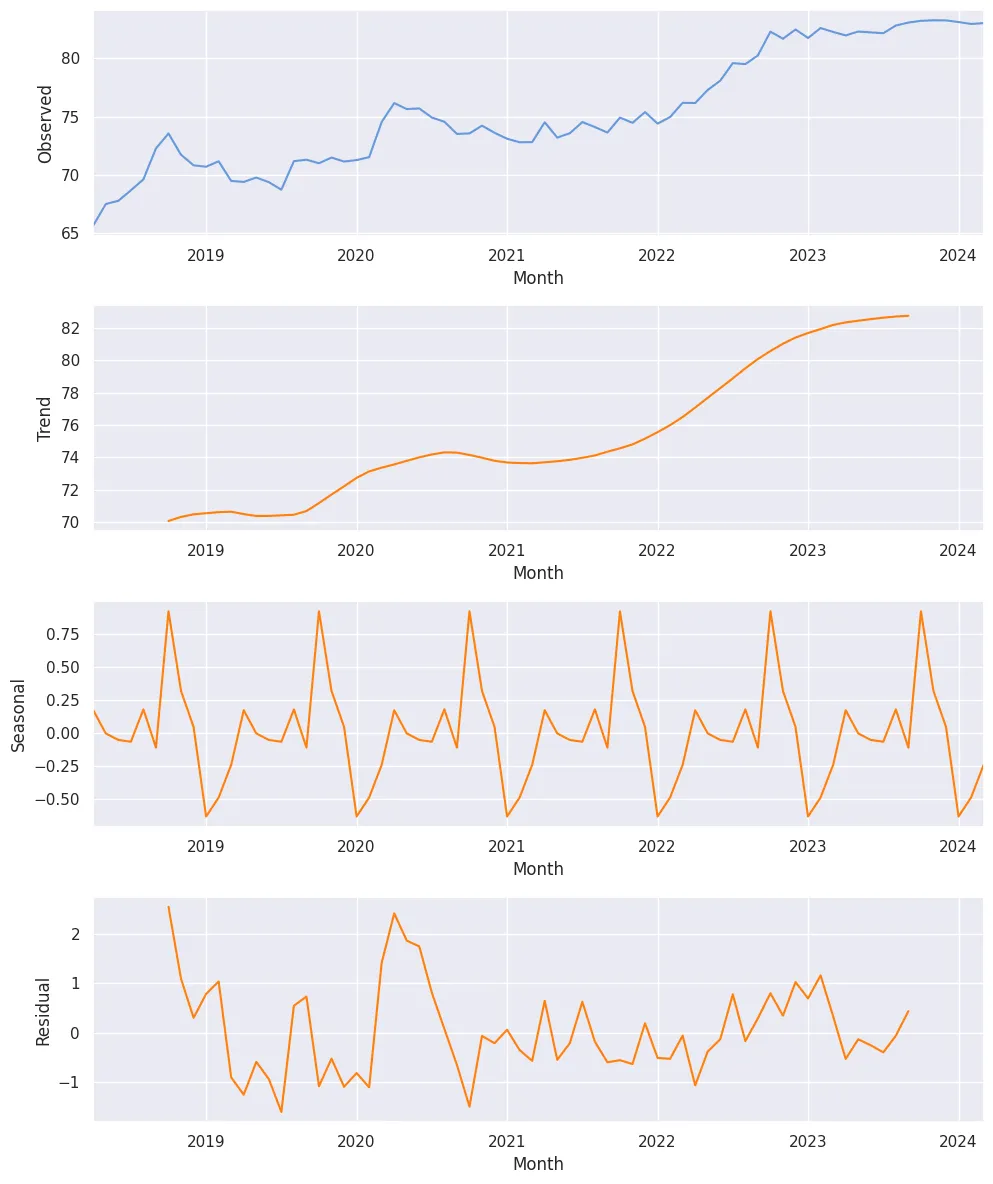
此外,我们还希望检查该数据的季节性分解。
result = seasonal_decompose(df['RUPEES/US$'], model='additive')
fig, (ax1, ax2, ax3, ax4) = plt.subplots(4, 1, figsize=(10, 12))
result.observed.plot(ax=ax1, color="#69d")
ax1.set_ylabel('Observed')
result.trend.plot(ax=ax2, color='#ff7f0e')
ax2.set_ylabel('Trend')
result.seasonal.plot(ax=ax3, color='#ff7f0e')
ax3.set_ylabel('Seasonal')
result.resid.plot(ax=ax4, color='#ff7f0e')
ax4.set_ylabel('Residual')
plt.tight_layout()
plt.show()
现在,对于 MLForecast,我们需要三列:
unique_id :unique_id 列用于识别数据集中的不同时间序列。- 它可以是字符串、整数或类别类型。
- 它代表数据中每个序列的标识符。
- 在处理同一数据集中的多个时间序列时,这一点尤其有用。
ds(日期戳): ds 列表示时间序列数据的时间部分。- 它应该采用 Pandas 可以解释为日期或时间戳的格式。
- 理想情况下,日期的格式应为 YYYY-MM-DD 或时间戳的格式应为 YYYY-MM-DD HH:MM:SS。
- 此列对于 MLForecast 理解数据的时间方面至关重要。
y(目标变量): y 列包含你要预测的实际值。- 它应该是数值。
- 这是你要预测的测量值或数量。
df = pd.DataFrame({'unique_id':[1]*len(df),
        'ds': df["Month"], "y":df['RUPEES/US$']})
让我们进行 “训练-测试 ”拆分
#Train-Test Split
train_size = int(len(df) * 0.8)
train, test = df.iloc[:train_size], df.iloc[train_size:]
print(f'Train set size: {len(train)}')
print(f'Test set size: {len(test)}')
训练集大小: 57
测试集大小:15
现在是建立模型的时候了--
models = [LinearRegression(),  # Simple linear regression model
    lgb.LGBMRegressor(verbosity=-1),  # LightGBM regressor with verbosity turned off
    xgb.XGBRegressor(),  # XGBoost regressor with default parameters
    RandomForestRegressor(random_state=0),  # Random Forest regressor with fixed random state for reproducibility
]
fcst = MLForecast(
    models=models,  # List of models to be used for forecasting
    freq='MS',  # Monthly frequency, starting at the beginning of each month
    lags=[1,3,5,7,12],  # Lag features: values from 1, 3, 5, 7, and 12 time steps ago
    lag_transforms={
        1: [  # Transformations applied to lag 1
            RollingMean(window_size=3),  # Rolling mean with a window of 3 time steps
            RollingStd(window_size=3),  # Rolling standard deviation with a window of 3 time steps
            RollingMin(window_size=3),  # Rolling minimum with a window of 3 time steps
            RollingMax(window_size=3),  # Rolling maximum with a window of 3 time steps
            RollingQuantile(p=0.5, window_size=3),  # Rolling median (50th percentile) with a window of 3 time steps
            ExpandingMean()  # Expanding mean (mean of all previous values)
        ],
        6:[  # Transformations applied to lag 6
            RollingMean(window_size=6),  # Rolling mean with a window of 6 time steps
            RollingStd(window_size=6),  # Rolling standard deviation with a window of 6 time steps
            RollingMin(window_size=6),  # Rolling minimum with a window of 6 time steps
            RollingMax(window_size=6),  # Rolling maximum with a window of 6 time steps
            RollingQuantile(p=0.5, window_size=6),  # Rolling median (50th percentile) with a window of 6 time steps
        ],
        12: [  # Transformations applied to lag 12 (likely for yearly seasonality)
            SeasonalRollingMean(season_length=12, window_size=3),  # Seasonal rolling mean with 12-month seasonality and 3-month window
            SeasonalRollingStd(season_length=12, window_size=3),  # Seasonal rolling standard deviation with 12-month seasonality and 3-month window
            SeasonalRollingMin(season_length=12, window_size=3),  # Seasonal rolling minimum with 12-month seasonality and 3-month window
            SeasonalRollingMax(season_length=12, window_size=3),  # Seasonal rolling maximum with 12-month seasonality and 3-month window
            SeasonalRollingQuantile(p=0.5, season_length=12, window_size=3)  # Seasonal rolling median with 12-month seasonality and 3-month window
        ]
    },
    date_features=['year', 'month', 'quarter'],  # Extract year, month, and quarter from the date as features
    target_transforms=[Differences([1])])  # Apply first-order differencing to the target variable
以上是预处理步骤的输出结果。
下一步,我们将继续生成预测结果。
fcst.fit(train_)
# Fits the MLForecast model to the training data
# This trains all specified models (LinearRegression, LGBMRegressor, XGBRegressor, RandomForestRegressor)
# and prepares the feature engineering pipeline
ml_prediction = fcst.predict(len(test_))
# Generates predictions for a horizon equal to the length of the test set
# Returns a DataFrame with predictions from all models
ml_prediction.rename(columns={'ds': 'Month'}, inplace=True)
# Renames the 'ds' column (default name for date/time column in MLForecast) to 'Month'
# This is done in-place, modifying the original DataFrame
fcst_result = test.copy()
# Creates a copy of the test DataFrame to store the results
# This preserves the original test data while allowing us to add predictions
fcst_result.set_index("Month", inplace=True)
# Sets the 'Month' column as the index of the fcst_result DataFrame
# This is done in-place, modifying the DataFrame
fcst_result["LinearRegression_fcst"]=ml_prediction["LinearRegression"].values
# Adds a new column 'LinearRegression_fcst' to fcst_result
# Populates it with the predictions from the LinearRegression model
fcst_result["LGBM_fcst"]=ml_prediction["LGBMRegressor"].values
# Adds a new column 'LGBM_fcst' to fcst_result
# Populates it with the predictions from the LGBMRegressor model
fcst_result["XGB_fcst"]=ml_prediction["XGBRegressor"].values
# Adds a new column 'XGB_fcst' to fcst_result
# Populates it with the predictions from the XGBRegressor model
fcst_result["RandomForest_fcst"]=ml_prediction["RandomForestRegressor"].values
# Adds a new column 'RandomForest_fcst' to fcst_result
# Populates it with the predictions from the RandomForestRegressor model
fcst_result.head()
# Displays the first five rows of the fcst_result DataFrame
# This allows you to see a preview of the results, including the actual values and predictions from all models
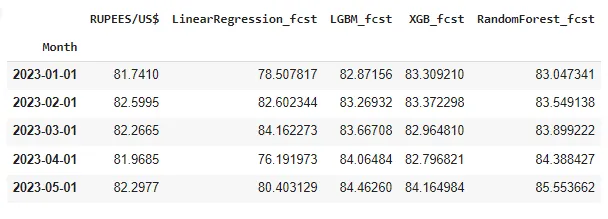
现在,生成的结果存储在数据帧 fcst_result 中。
然后,我们可以定义一个函数来评估这些模型的性能。
#Defining a function to calculate the error metrics
def calculate_error_metrics(actual_values, predicted_values):
    actual_values = np.array(actual_values)
    predicted_values = np.array(predicted_values)
    metrics_dict = {
        'MAE': np.mean(np.abs(actual_values - predicted_values)),  # Mean Absolute Error
        'RMSE': np.sqrt(np.mean((actual_values - predicted_values)**2)),  # Root Mean Square Error
        'MAPE': np.mean(np.abs((actual_values - predicted_values) / actual_values)) * 100}  # Mean Absolute Percentage Error
    result_df = pd.DataFrame(list(metrics_dict.items()), columns=['Metric', 'Value'])
    return result_df
# Extracting actual values from the result DataFrame
actuals = fcst_result['RUPEES/US$']
# Dictionary to store error metrics for each model
error_metrics_dict = {}
# Calculating error metrics for each model's predictions
for col in fcst_result.columns[1:]:  # Iterating through prediction columns (skipping the first column which is likely the actual values)
    predicted_values = fcst_result[col]
    error_metrics_dict[col] = calculate_error_metrics(actuals, predicted_values)['Value'].values  # Extracting 'Value' column
# Creating a DataFrame from the error metrics dictionary
error_metrics_df = pd.DataFrame(error_metrics_dict).T.reset_index()
error_metrics_df.columns = ['Model', 'MAE', 'RMSE', 'MAPE']  # Renaming columns for clarity
print(error_metrics_df)
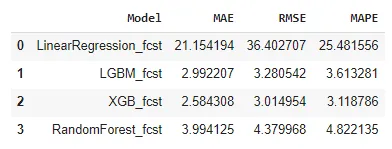
这表明该模型在处理这些数据时表现良好。值得注意的是,与前一篇文章不同,本研究并没有将 ML 模型与其他统计或深度学习模型进行比较。本文的主要目的是为将 MLForecast 纳入预测工具包提供参考。
结论
在本文中,我们探讨了 MLForecast 库,它是 Nixtla 生态系统中的一个强大工具,专为使用机器学习模型进行时间序列预测而设计。我们讨论了它的主要特点、功能,以及为满足预测需求而实施 MLForecast 所涉及的步骤。通过提供自动特征创建、高效处理多个时间序列以及支持大规模预测,MLForecast 成为时间序列分析的强大解决方案。虽然这项研究没有将 ML 模型与其他统计或 DL 模型进行比较,但它为将 MLForecast 集成到预测工作流程中提供了全面的参考。随着机器学习的不断发展,MLForecast 等工具将在提高时间序列预测的准确性和效率方面发挥越来越重要的作用。


