利用LLM进行半结构化和非结构化文档分析的方法
文档解析是对文档内容(非结构化或半结构化)进行分析的过程,目的是提取特定信息或将内容转换为更结构化的格式。文档解析的目的是将文档分解为各个组成部分,并对这些部分进行解释。文档解析对于需要处理各种格式的大量数据并进行自动数据提取的组织非常有用。文档解析在业务中可能有多种用途,例如发票处理、法律合同分析、多来源客户反馈分析和财务报表分析等等。
在大型语言模型(LLM)出现之前,文档解析是使用正则表达式(Regex)等预定义规则完成的。然而,这些规则缺乏灵活性,仅限于预定义的结构。现实世界中的文档往往存在不一致的地方,并不遵循固定的结构或格式。因此,LLM 在从半结构化或非结构化文档中提取特定信息以供进一步分析方面具有巨大潜力。、
在本文中,我将通过一个实际例子来解释如何使用 LLM 从半结构化和非结构化文档中自动提取所需信息,并随后对这些信息进行分析。
下图显示了使用 LLM 进行文档解析和后续分析的整个工作流程。

让我们逐一完成这些步骤。
1. 文本提取
本示例中使用的文档包括我们在咨询会议后向公司提供的人工智能咨询反馈。这些公司包括初创公司和成熟公司,它们希望将人工智能整合到自己的业务中,或希望推进现有的人工智能解决方案。反馈文件是一份半结构化文件,其格式如下所示。由于隐私方面的限制,本文件中的姓名和其他信息均有改动。
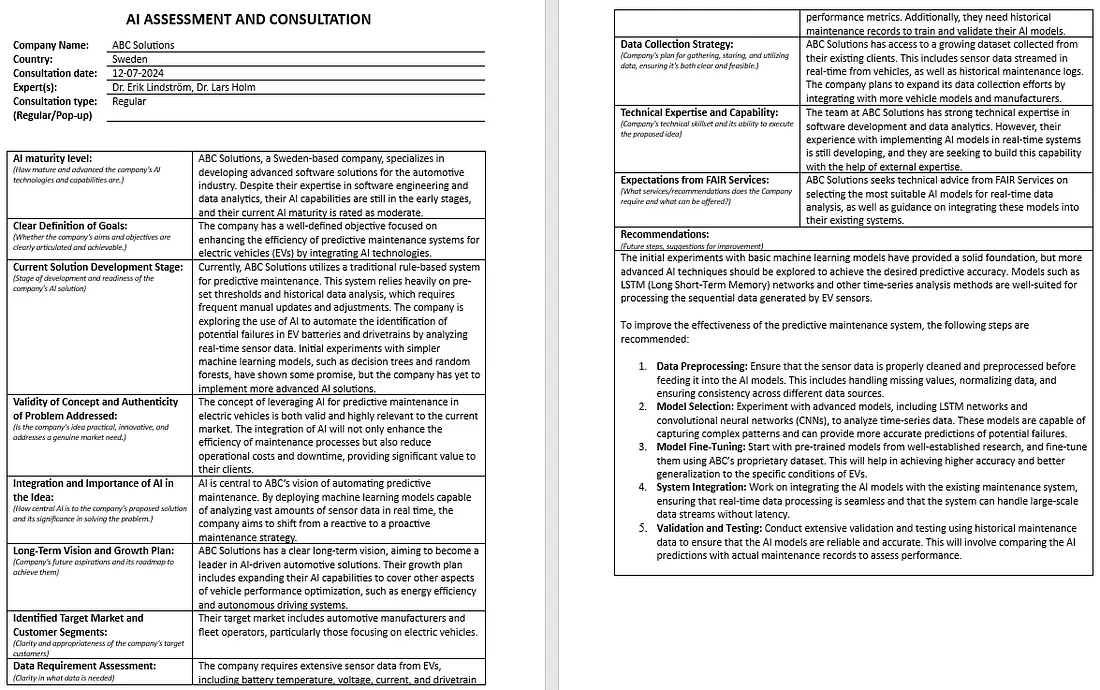
人工智能专家为每个领域提供分析。然而,面对数以百计的此类文档,从数据中提取洞察力成为一项具有挑战性的任务。要深入了解这些数据,需要将其转换为简明、结构化的格式,以便使用现有的统计或机器学习方法进行分析。手动执行这种转换不仅耗费大量人力和时间,而且容易出错。
除了文档中容易看到的信息,如公司名称、咨询日期和涉及的专家,我的目标是提取具体细节以作进一步分析。其中包括每家公司所处的主要行业或领域、对当前所提供解决方案的简明描述、人工智能主题、公司类型、人工智能成熟度、目标以及建议摘要。这种提取需要对与每个字段相关的详细文本进行。此外,随着时间的推移,反馈模板也在不断变化,这导致文档格式不一致。
在讨论从文档中提取文本之前,请注意需要安装以下库才能运行本文使用的完整代码。
# Install the required libraries
!pip install tqdm  # For displaying a progress bar for document processing
!pip install requests  # For making HTTP requests
!pip install pandas  # For data manipulation and analysis
!pip install python-docx  # For processing Word documents
!pip install plotly  # For creating interactive visualizations
!pip install numpy  # For numerical computations
!pip install scikit-learn  # For machine learning algorithms and tools
!pip install matplotlib  # For creating static, animated, and interactive plots
!pip install openai  # For interacting with the OpenAI API
!pip install seaborn  # For statistical data visualization
以下代码使用 python-docx 库从文档(.docx 格式)中提取文本。重要的是要从所有格式中提取文本,包括段落、表格、页眉和页脚。
def extract_text_from_docx(docx_path: str):
    """
    Extract text content from a Word (.docx) file.
    """
    doc = docx.Document(docx_path)
    full_text = []
    # Extract text from paragraphs
    for para in doc.paragraphs:
        full_text.append(para.text)
    # Extract text from tables
    for table in doc.tables:
        for row in table.rows:
            for cell in row.cells:
                full_text.append(cell.text)
    # Extract text from headers and footers
    for section in doc.sections:
        header = section.header
        footer = section.footer
        for para in header.paragraphs:
            full_text.append(para.text)
        for para in footer.paragraphs:
            full_text.append(para.text)
    return '\n'.join(full_text).strip()
2. 设置 LLM 提示
我们需要指导 LLM 如何从文档中提取所需的信息。此外,我们还需要解释要提取的每个相关字段的含义,以便它能从文档中提取语义匹配的信息。这一点尤为重要,因为由一个或多个单词组成的必填字段可以有多种解释。例如,我们需要解释 “目的 ”的含义,它基本上是指公司的人工智能集成计划或公司希望如何推进其当前的解决方案。因此,为此精心设计正确的提示非常重要。
我在系统提示中设置了指导 LLM 行为的指令。输入提示包括 LLM 要处理的数据。系统提示符如下所示。
# System prompt with extraction instructions
system_message = """
You are an expert in analyzing and extracting information from the feedback forms written by AI experts after AI advisory sessions with companies.
Please carefully read the provided feedback form and extract the following 15 key information. Make sure that the key names are exactly the same as
given below. Do not create any additional key names other than these 15.
Key names and their descriptions:
1. Company name: name of the company seeking AI advisory
2. Country: Company's country [output 'N/A' if not available]
3. Consultation Date [output 'N/A' if not available]
4. Experts: persons providing AI consultancy [output 'N/A' if not available]
5. Consultation type: Regular or pop-up [output 'N/A' if not available]
6. Area/domain: Field of the company’s operations. Some examples: healthcare, industrial manufacturing, business development, education, etc.
7. Current Solution: description of the current solution offered by the company. The company could be currently in ideation phase. Some examples of ‘Current Solution’ field include i) Recommendation system for cars, houses, and other items, ii) Professional guidance system, iii) AI-based matchmaking service for educational peer-to-peer support. [Be very specific and concise]
8. AI field: AI's sub-field in use or required. Some examples: image processing, large language models, computer vision, natural language processing, predictive modeling, speech recognition, etc. [This field is not explicitly available in the document. Extract it by the semantic understanding of the overall document.]
9. AI maturity level: low, moderate, high [output 'N/A' if not available].
10. Company type: ‘startup’ or ‘established company’
11. Aim: The AI tasks the company is looking for. Some examples: i) Enhance AI-driven systems for diagnosing heart diseases, ii) to automate identification of key variable combinations in customer surveys, iii) to develop AI-based system for automatic quotation generation from engineering drawings, iv) to building and managing enterprise-grade LLM applications. [Be very specific and concise]
12. Identified target market: The targeted customers. Some examples: healthcare professionals, construction firms, hospitality, educational institutions, etc.
13. Data Requirement Assessment: The type of data required for the intended AI integration? Some examples: Transcripts of therapy sessions, patient data, textual data, image data, videos, etc.
14. FAIR Services Sought: The services expected from FAIR. For instance, technical advice, proof of concept.
15. Recommendations: A brief summary of the recommendations in the form of key words or phrase list. Some examples: i) Focus on data balance, monitor for bias, prioritize transparency, ii) Explore machine learning algorithms, implement decision trees, gradient boosting. [Be very specific and concise]
Guidelines:
- Very important: do not make up anything. If the information of a required field is not available, output ‘N/A’ for it.
- Output in JSON format. The JSON should contain the above 15 keys.
"""
3. 处理文件
处理文档是指将数据发送给 LLM 进行解析。我使用 OpenAI 的 gpt-4o-mini 模型进行文档解析,它是一种经济实惠的智能小型模型,适用于快速、轻量级任务。GPT-4o mini 比 GPT-3.5 Turbo 更便宜,功能也更强大。不过,也可以测试 Llama、Mistral 或 Phi-3 等开放式 LLM 的轻量级版本。
下面的代码会浏览一个目录及其子目录,找到人工智能咨询文档(.docx 格式),从每个文档中提取文本,并通过 API 调用将文档发送到 gpt-4o-mini。
def process_files(directory_path: str, api_key: str, system_message: str):
    """
    Process all .docx files in the given directory and its subdirectories,
    send their content to the LLM, and store the JSON responses.
    """
    json_outputs = []
    docx_files = []
    # Walk through the directory and its subdirectories to find .docx files
    for root, dirs, files in os.walk(directory_path):
        for file in files:
            if file.endswith(".docx"):
                docx_files.append(os.path.join(root, file))
    if not docx_files:
        print("No .docx files found in the specified directory or sub-directories.")
        return json_outputs
    # Iterate through all .docx files in the directory with a progress bar
    for file_path in tqdm(docx_files, desc="Processing files...", unit="file"):
        filename = os.path.basename(file_path)
        extracted_text = extract_text_from_docx(file_path)
        # Prepare the user message with the extracted text
        input_message = extracted_text
        # Prepare the API request payload
        headers = {
            "Content-Type": "application/json",
            "Authorization": f"Bearer {api_key}"
        }
        payload = {
            "model": "gpt-4o-mini",
            "messages": [
                {"role": "system", "content": system_message},
                {"role": "user", "content": input_message}
            ],
            "max_tokens": 2000,
            "temperature": 0.2
        }
        # Send the request to the LLM API
        response = requests.post("https://api.openai.com/v1/chat/completions", headers=headers, json=payload)
        # Extract the JSON response
        json_response = response.json()
        content = json_response['choices'][0]['message']['content'].strip("```json\n").strip("```")
        parsed_json = json.loads(content)
        # Normalize the parsed JSON output
        normalized_json = normalize_json_output(parsed_json)
        # Append the normalized JSON output to the list
        json_outputs.append(normalized_json)
    return json_outputs
在调用的有效载荷中,我将标记的最大数量(max_tokens)设置为 2000,以适应输入/输出标记。我设置了一个相对较低的温度(0.2),这样 LLM 就不会有太高的创造力,而这并不是这项任务所需要的。温度过高可能会导致 LLM 产生幻觉,从而编造新信息。
LLM 的响应以 JSON 对象的形式接收,并在下一节中进一步解析和规范化。
4. 解析 LLM 输出
如上面的代码所示,从应用程序接口收到的响应是一个 JSON 对象(parsed_json),使用下面的函数对其进行进一步规范化。
def normalize_json_output(json_output):
    """
    Normalize the keys and convert list values to comma-separated strings.
    """
    normalized_output = {}
    for key, value in json_output.items():
        normalized_key = key.lower().replace(" ", "_")
        if isinstance(value, list):
            normalized_output[normalized_key] = ', '.join(value)
        else:
            normalized_output[normalized_key] = value
    return normalized_output
该函数将 JSON 对象的键值转换为小写字母,并用下划线替换空格,从而使其标准化。此外,它还会将任何列表值转换为逗号分隔字符串,使数据更易于处理和分析。
规范化后的 JSON 对象(json_outputs)包含从所有文档中提取的关键信息,最终会保存到 Excel 文件中。
def save_json_to_excel(json_outputs, output_file_path: str):
    """
    Save the list of JSON objects to an Excel file with a SNO. column.
    """
    # Convert the list of JSON objects to a DataFrame
    df = pd.DataFrame(json_outputs)
    # Add a Serial Number (SNO.) column
    df.insert(0, 'SNO.', range(1, len(df) + 1))
    # Ensure all columns are consistent and save the DataFrame to an Excel file
    df.to_excel(output_file_path, index=False)
Excel 文件的快照如下所示。由 LLM 驱动的解析产生了与所需字段相关的精确信息。快照中的 “N/A ”表示文件中没有的数据(旧的反馈模板缺少这些信息)

最后,调用上述所有函数的代码如下。请注意,运行此代码需要 OpenAI 的 API 密钥。
# Directory containing files
directory_path = 'Documents'
# API key for GPT-4-mini
api_key = 'YOUR_OPENAI_API_KEY'
# Process files and get the JSON outputs
json_outputs = process_files(directory_path, api_key, system_message)
if json_outputs:
    # Save the JSON outputs to an Excel file
    output_file_path = 'processed-gpt-o-mini.xlsx'
    save_json_to_excel(json_outputs, output_file_path)
    print(f"Processed data has been saved to {output_file_path}")
else:
    print("No .docx file found.")
我还解析了相同文档的一些非结构化版本。下面是同一人工智能反馈的非结构化版本的快照。由于隐私方面的限制,该版本中的姓名和重要细节已被修改。
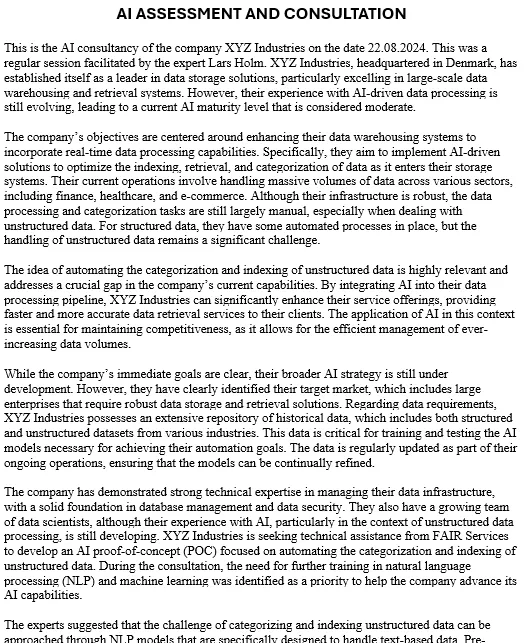
解析结果提供了同样精确和准确的信息。解析结果快照如下。

5. 执行数据分析
现在我们有了结构化文档,可以对这些数据进行多项分析。甚至可以进一步使用 LLM 来建议几种分析,甚至使用给定的数据进行分析和/或帮助编写分析代码。例如,我快速进行了以下两项分析,以找出公司的人工智能成熟度分布和公司类型分布。下面的代码可以直观地了解这些分布情况。
import pandas as pd
import plotly.express as px
# Load the dataset
file_path = 'processed-gpt-o-mini.xlsx' # Update this to match your file path
data = pd.read_excel(file_path)
# Convert fields to lowercase
data['ai_maturity_level'] = data['ai_maturity_level'].str.lower()
data['company_type'] = data['company_type'].str.lower()
# Plot for AI Maturity Level
fig_ai_maturity = px.bar(data,
                         x='ai_maturity_level',
                         title="AI Maturity Level Distribution",
                         labels={'ai_maturity_level': 'AI Maturity Level', 'count': 'Number of Companies'})
# Update layout for AI Maturity Level plot
fig_ai_maturity.update_layout(
    xaxis_title="AI Maturity Level",
    yaxis_title="Number of Companies",
    xaxis={'categoryorder':'total descending'},  # Order bars by descending number of companies
    yaxis=dict(type='linear'),
    showlegend=False
)
# Display the AI Maturity Level figure
fig_ai_maturity.show()
# Plot for Company Type
fig_company_type = px.bar(data,
                          x='company_type',
                          title="Company Type Distribution",
                          labels={'company_type': 'Company Type', 'count': 'Number of Companies'})
# Update layout for Company Type plot
fig_company_type.update_layout(
    xaxis_title="Company Type",
    yaxis_title="Number of Companies",
    xaxis={'categoryorder':'total descending'},  # Order bars by descending number of companies
    yaxis=dict(type='linear'),
    showlegend=False
)
# Display the Company Type figure
fig_company_type.show()
以下是该代码生成的图表。


还可以对领域/领域、当前解决方案、人工智能领域、目标市场和专家建议进行进一步分析,以找到这些领域的主要专题或集群。为了演示的目的,我只对领域/领域进行了聚类,以找到这些公司运营的主要行业。
为此,我执行了以下步骤。
- 使用 OpenAI 的text-embedding-3-small嵌入模型计算 “地区/领域 ”字段中文本的嵌入。或者,也可以使用开放式嵌入模型,如 all-MiniLM-L12-v2。
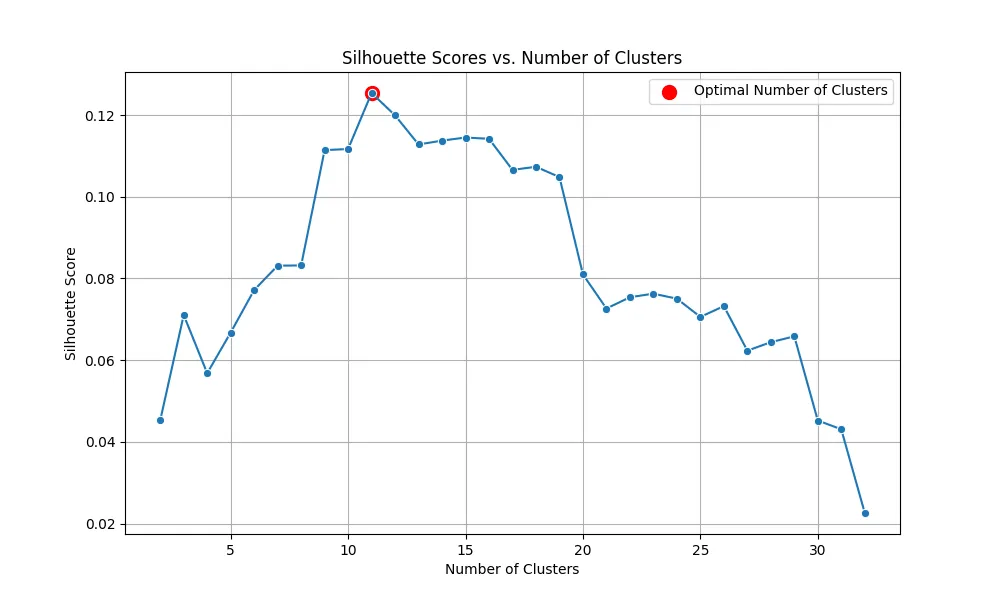
- 对嵌入应用 K-means 聚类算法,并尝试使用不同数量的聚类,以找到最佳聚类。具体方法是计算每个聚类结果的 Silhouette 分数,以评估聚类的质量。Silhouette 分数最高的聚类数目被选为最佳数目。
- 使用最佳聚类数对数据进行聚类。
- 将聚类发送给 gpt-4o-mini 模型,根据聚类中所有数据点的语义相似性为每个聚类分配一个标签。
- 使用标签聚类代表寻求人工智能咨询的公司所属的主要行业。
以下代码使用 OpenAI 的文本嵌入-3-smalle mbedding 模型计算嵌入。
def fetch_embeddings(texts, filename):
    # Check if the embeddings file already exists
    if os.path.exists(filename):
        print(f"Loading embeddings from {filename}...")
        with open(filename, 'rb') as f:
            embeddings = pickle.load(f)
    else:
        print("Computing embeddings...")
        embeddings = []
        for text in texts:
            embedding = client.embeddings.create(input=[text], model="text-embedding-3-small").data[0].embedding
            embeddings.append(embedding)
        embeddings = np.array(embeddings)
        # Save the embeddings to a file for future use
        print(f"Saving embeddings to {filename}...")
        with open(filename, 'wb') as f:
            pickle.dump(embeddings, f)
    return embeddings
计算完嵌入后,下面的代码片段会利用计算出的嵌入,通过 k-means 聚类找到最佳的聚类数量。在计算嵌入之前,先计算区域/域字段中的唯一名称;不过,同样重要的是要跟踪原始索引,以便日后分析。区域/域字段中的唯一名称包含在重复域(deduplicated_domains)列表中。
# Load the dataset
file_path = 'C:/Users/h02317/Downloads/processed-gpt-o-mini.xlsx'
data = pd.read_excel(file_path)
# Extract the "area/domain" field and process the data
area_domain_data = data['area/domain'].dropna().tolist()
# Deduplicate the data while keeping track of the original indices
deduplicated_domains = []
original_to_dedup = []
for item in area_domain_data:
    item_lower = item.strip().lower()
    if item_lower not in deduplicated_domains:
        deduplicated_domains.append(item_lower)
    original_to_dedup.append(deduplicated_domains.index(item_lower))
# Fetch embeddings for all deduplicated domain data points
embeddings = fetch_embeddings(deduplicated_domains, filename="all_domains_embeddings_2.pkl")
# Determine the optimal number of clusters using the silhouette score
silhouette_scores = []
K_range = list(range(2, len(deduplicated_domains)))  # Testing between 2 and the total number of unique domains
print('Finding optimal number of clusters')
for k in K_range:
    kmeans = KMeans(n_clusters=k, random_state=42)
    kmeans.fit(embeddings)
    score = silhouette_score(embeddings, kmeans.labels_)
    silhouette_scores.append(score)
# Find the optimal number of clusters
optimal_k = K_range[np.argmax(silhouette_scores)]
print(f'Optimal number of clusters: {optimal_k}')
# Plot the silhouette scores
plot_silhouette_scores(K_range, silhouette_scores, optimal_k)
下图显示了所有集群的剪影得分和最佳集群数。
使用以下代码片段,以最优的簇数(optimal_k)进行聚类。具有唯一数据点的聚类存储在 dedup_clusters 中。这些簇也会映射到原始数据点,并存储在 original_clusters 中,以备日后使用。
# Perform k-means clustering with the optimal number of clusters
kmeans = KMeans(n_clusters=optimal_k, random_state=42)
kmeans.fit(embeddings)
dedup_clusters = kmeans.labels_
# Map clusters back to the original data points
original_clusters = [dedup_clusters[idx] for idx in original_to_dedup]
original_clusters被发送到 gpt-4o-mini 模型,以分配标签。以下代码片段显示了系统和与有效载荷一起发送的输入提示。输出以 JSON 格式接收。在这项任务中,我们选择了较高的温度(0.7),这样模型就可以利用一些创造力来分配合适的标签。
# Function to label clusters using GPT-4-o-mini
def label_clusters_with_gpt(clusters, api_key):
    # Prepare the input for GPT-4
    cluster_descriptions = []
    for cluster_id, data_points in clusters.items():
        cluster_descriptions.append(f"Cluster {cluster_id}: {', '.join(data_points)}")
    # Prepare the system and input messages
    system_message = "You are a helpful assistant"
    input_message = (
        "Please label each of the following clusters with a concise, specific label based on the semantic similarity "
        "of the data points within each cluster."
        "Output in a JSON format where the keys are cluster numbers and the values are cluster labels."
        "\n\n" + "\n".join(cluster_descriptions)
    )

    # Set up the request payload
    headers = {
        "Content-Type": "application/json",
        "Authorization": f"Bearer {api_key}"
    }
    payload = {
        "model": "gpt-4o-mini",  # Model name
        "messages": [
            {"role": "system", "content": system_message},
            {"role": "user", "content": input_message}
        ],
        "max_tokens": 2000,
        "temperature": 0.7
    }

    # Send the request to the API
    response = requests.post("https://api.openai.com/v1/chat/completions", headers=headers, json=payload)

    # Extract and parse the response
    if response.status_code == 200:
        response_data = response.json()
        response_text = response_data['choices'][0]['message']['content'].strip()
        try:
            # Ensure that the JSON is correctly formatted
            response_text = response_text.replace("```json", "").replace("```", "").strip()
            cluster_labels = json.loads(response_text)
        except json.JSONDecodeError as e:
            print("Failed to parse JSON:", e)
            cluster_labels = {}

        return cluster_labels
    else:
        print(f"Request failed with status code {response.status_code}")
        print("Response Body:", response.text)
        return None
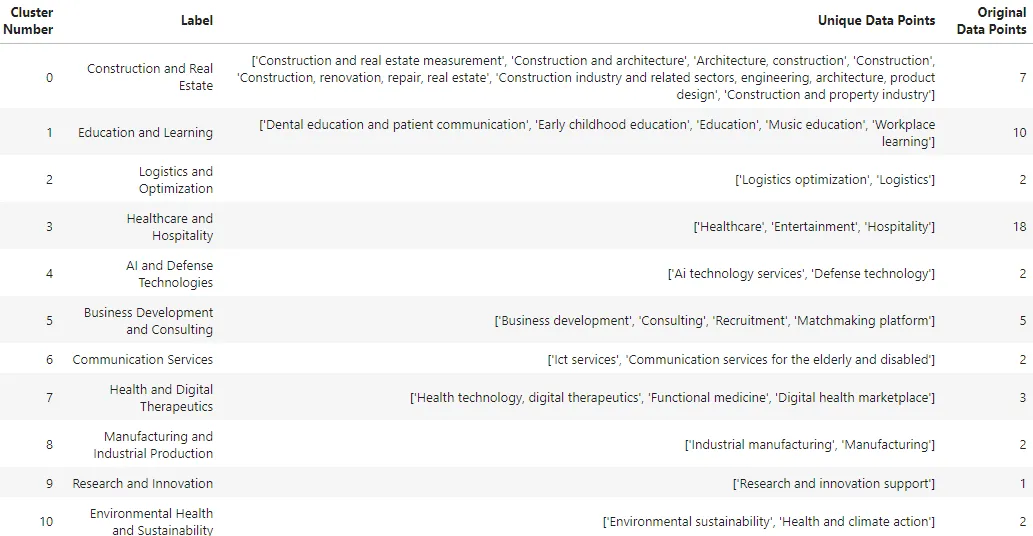
下面的函数 clusters_too_dataframe 将 gpt-4o-mini 的 JSON 输出转换为结构化的 pandas DataFrame。它通过将每个群集的标签、相关数据点和原始数据点的计数转换成表格格式,来组织有标签的群集。该函数确保每个聚类都能通过其编号、标签和内容清晰地识别出来,从而使聚类结果更易于分析和可视化。生成的数据帧按聚类编号排序,提供了一个简洁、有序的数据视图。
# Function to convert the JSON labeled clusters into a DataFrame
def clusters_to_dataframe(cluster_labels, clusters, original_clustered_data):
    data = {"Cluster Number": [], "Label": [], "Data Points": [], "Original Data Points": []}

    # Iterate through the cluster labels
    for cluster_num, label in cluster_labels.items():
        cluster_num = int(cluster_num)  # Convert cluster number to integer
        data["Cluster Number"].append(cluster_num)
        data["Label"].append(label)
        data["Data Points"].append(repr(clusters[cluster_num]))  # Use repr to retain the original list format
        data["Original Data Points"].append(len(original_clustered_data[cluster_num]))  # Count original data points

    # Convert to DataFrame and sort by "Cluster Number"
    df = pd.DataFrame(data)
    df = df.sort_values(by='Cluster Number').reset_index(drop=True)
    return df
该函数返回的最终数据帧如下所示。
以下代码片段绘制了各行业公司数量的可视化图表。
'''draw visualization'''
import plotly.express as px
# Use the "Original Data Points" column for the number of companies
df_labeled_clusters['No. of companies'] = df_labeled_clusters['Original Data Points']
# Create the Plotly bar chart
fig = px.bar(df_labeled_clusters,
             x='Label',
             y='No. of companies',
             title="Number of Companies per Sector",
             labels={'Label': 'Sectors', 'No. of companies': 'No. of Companies'})
# Update layout for better visibility
fig.update_layout(
    xaxis_title="Sectors",
    yaxis_title="No. of Companies",
    xaxis={'categoryorder':'total descending'},  # Order bars by descending number of companies
    yaxis=dict(type='linear'),
    showlegend=False
)
# Display the figure
fig.show()

结论
在本文中,我演示了如何使用 LLM 将半结构化和非结构化文档中的数据转换为结构化格式。随后,可以使用传统的机器学习和统计方法对结构化数据进行进一步分析。


