使用Kolmogorov-Arnold网络进行时间序列异常检测
时间序列数据是捕捉随时间变化的模式的一种有用表示形式。时间序列数据中的异常检测是一项复杂任务,因为异常并不一定是离群值,而是取决于数据集的上下文。传统的异常检测方法在处理时间序列数据集特有的复杂性和非线性特征时往往力不从心,从而限制了其有效性和可扩展性。此时,科尔莫戈罗夫-阿诺德网络(Kolmogorov-Arnold Networks,简称KAN)应运而生,这是一种受科尔莫戈罗夫-阿诺德表示定理启发的尖端机器学习方法。KAN提供了一个强大的框架,能够以更高的精度对复杂的时间模式进行建模。在本文中,你将学习如何使用KAN来检测时间序列数据中的异常。
背景
理论基础
科尔莫戈罗夫-阿诺德表示定理指出,任何多元连续函数都可以表示为单变量连续函数和加法的有限和与组合。对于KAN,可以表述为:对于任何连续函数,都存在关于q的连续函数ϕ和ψpq,使得:

该定理为科尔莫戈罗夫-阿诺德网络(Kolmogorov-Arnold Networks,简称KAN)提供了理论基础,KAN通过组合和求和单变量函数来近似复杂的多元函数。这使得KAN中的激活函数可以在边上执行,使激活函数变得“可学习”,并提高了其性能。通过这种特性,KAN在建模非线性和高维关系方面特别强大,使其适用于时间序列异常检测。
为什么使用KAN进行时间序列异常检测?
以下是KAN在时间序列异常检测中有效的几个原因:
- 通用函数近似:KAN可以近似任何连续函数,使它们能够准确地建模正常时间序列数据中的潜在模式。
- 对异常敏感:异常是正常模式的偏差。KAN精确建模正常行为的能力使它们对这种偏差非常敏感。
- 分层特征学习:通过堆叠层,KAN可以捕获局部和全局模式,这对于检测不同类型的异常(点异常、上下文异常和集体异常)至关重要。
教程概述
本文将展示如何基于KAN对合成数据进行时间序列异常检测。
我们将首先将连续时间序列分割成窗口,每个窗口捕获包含正常模式和潜在异常的一组特定数据点。
窗口化是一种将连续时间序列数据分割成更小、更易管理的块(称为窗口或段)的技术。
每个窗口捕获时间序列的一个特定部分,使模型能够分析该段内的模式和依赖关系。
我们将使用重叠窗口,即窗口的间隔是重叠的。这可以更准确地检测异常,并为KAN学习跨越多个窗口的时间依赖关系提供便利。
然后,根据窗口中是否存在任何异常行为,将这些窗口标记为不同的类别。
类别定义:
- 正常窗口(类0):不包含任何异常的窗口。
- 异常窗口(类1):包含至少一个异常的窗口。
我们确保使用这些类别标记窗口,以保持我们项目每个数据集(训练集、验证集、测试集)中异常窗口数量的平衡。
为了平衡每组数据中异常窗口的数量,我们使用SMOTE(合成少数类过采样技术)。这种技术会生成少数类(异常)的合成样本以平衡数据集,确保模型在训练期间接收到两类足够的样本。
为了有效地从这些数据中学习,模型会处理每个窗口,通过多层基于傅里叶的变换提取复杂的时间特征,这增强了它识别预期模式细微偏差的能力。
通过在这些结构化段上进行训练,KAN模型学会了区分典型序列和异常序列,使其能够准确识别新未见数据中的不规则性。
导入库
我们将使用以下库:
- PyTorch:用于构建和训练神经网络。
- NumPy:用于数值计算。
- Scikit-learn:用于评估指标和数据预处理。
- Matplotlib:用于数据可视化。
import torch
import torch.nn as nn
import torch.nn.functional as F
import numpy as np
import random
from sklearn.metrics import (
    precision_score,
    recall_score,
    f1_score,
    roc_auc_score,
    precision_recall_curve,
    roc_curve,
    auc,
)
from sklearn.model_selection import train_test_split
from sklearn.preprocessing import StandardScaler
import matplotlib.pyplot as plt
from torch.utils.data import DataLoader
项目设置
以下是我们将在此模型中使用的参数。
关键参数:
- window_size:时间序列上滑动窗口的大小。
- step_size:滑动窗口移动的步长。
- anomaly_fraction:包含异常的数据窗口的比例。
- dropout:防止过拟合的丢弃率。
- hidden_size:KAN(可能是指某种自适应网络,如Kernel Attention Network)中隐藏层的大小。
- grid_size:KAN层中使用的傅里叶频率的数量。
- n_layers:模型中堆叠的KAN层的数量。
- epochs:训练周期的数量。
- early_stopping:训练期间提前停止的耐心参数。
- lr:优化器的学习率。
- batch_size:训练期间每个批次的样本数量。
确保运行.seed()函数以验证此模型中使用的随机数的随机性。
# Set random seeds for reproducibility
class Args:
    path = "./data/"
    dropout = 0.3
    hidden_size = 128
    grid_size = 50
    n_layers = 2
    epochs = 200
    early_stopping = 30  # Increased patience
    seed = 42
    lr = 1e-3  # Increased learning rate
    window_size = 20
    step_size = 10
    batch_size = 32
    anomaly_fraction = 0.1
args = Args()
args.device = torch.device("cuda" if torch.cuda.is_available() else "cpu")
random.seed(args.seed)
np.random.seed(args.seed)
torch.manual_seed(args.seed)
if torch.cuda.is_available():
    torch.cuda.manual_seed_all(args.seed)
生成合成数据
我们将通过以下方式构建包含异常的时间序列数据:
- 正弦波生成:我们使用np.sin(x)创建一个正弦波。
- 异常注入:随机选择窗口中心,并根据异常类型注入异常。
- 标记:创建一个标签数组来标记异常
我们将在正弦波时间序列中引入三种策略来产生异常。
- 点异常:在单个数据点上添加大的随机噪声。
- 上下文异常:将特定的正弦值通过随机因子进行放大。
- 集体异常:通过向连续数据点的窗口添加噪声来模拟更大范围、群体级别的扰动。
这些异常被插入到正弦波中随机选择的位置,并创建一个相应的标签数组,标记异常的位置。
在生成带有异常的正弦波后,我们使用StandardScaler(来自sci-kit-learn库)对时间序列进行归一化和缩放。
def generate_sine_wave_with_anomalies(
    length=5000, anomaly_fraction=0.1, window_size=20, step_size=10
):
    x = np.linspace(0, 100 * np.pi, length)
    y = np.sin(x)
    labels = np.zeros(length)
    window_centers = list(range(window_size // 2, length - window_size // 2, step_size))
    num_anomalies = int(len(window_centers) * anomaly_fraction)
    anomaly_centers = np.random.choice(window_centers, num_anomalies, replace=False)
    for center in anomaly_centers:
        anomaly_type = np.random.choice(['point', 'contextual', 'collective'])
        if anomaly_type == 'point':
            y[center] += np.random.normal(0, 10)
            labels[center] = 1
        elif anomaly_type == 'contextual':
            y[center] = y[center] * np.random.uniform(1.5, 2.0)
            labels[center] = 1
        elif anomaly_type == 'collective':
            start = max(0, center - window_size // 2)
            end = min(length, center + window_size // 2)
            y[start:end] += np.random.normal(0, 5, size=end - start)
            labels[start:end] = 1  # Mark the entire window as anomalous
    return y, labels

time_series, labels = generate_sine_wave_with_anomalies(
    length=5000,
    anomaly_fraction=args.anomaly_fraction,
    window_size=args.window_size,
    step_size=args.step_size,
)
scaler = StandardScaler()
time_series = scaler.fit_transform(time_series.reshape(-1, 1)).flatten()
构建TimeSeriesAnomalyDataset类
为了高效地处理时间序列数据,我们创建了一个自定义数据集类,该类将连续的时间序列分割成重叠的窗口。每个窗口捕获数据的一个特定段,该段可能包含正常模式或异常。
重要细节:
- 窗口创建:我们使用window_size(窗口大小)和step_size(步长)创建重叠的窗口。
- 标签分配:如果窗口内的任何点是异常点,则该窗口被标记为异常。
- 数据检索:__getitem__方法检索窗口及其对应的标签。
# Define the custom dataset with overlapping windows
class TimeSeriesAnomalyDataset(torch.utils.data.Dataset):
    def __init__(
        self, time_series, labels, window_size=20, step_size=10, transform=None
    ):
        self.time_series = time_series
        self.labels = labels
        self.window_size = window_size
        self.step_size = step_size
        self.transform = transform
        self.sample_indices = list(
            range(0, len(time_series) - window_size + 1, step_size)
        )
    def __len__(self):
        return len(self.sample_indices)
    def __getitem__(self, idx):
        if idx >= len(self.sample_indices) or idx < 0:
            raise IndexError(
                f"Index {idx} out of range for sample_indices of length {len(self.sample_indices)}"
            )
        i = self.sample_indices[idx]
        window = self.time_series[i : i + self.window_size]
        window_labels = self.labels[i : i + self.window_size]
        # Input features: window values
        x = torch.tensor(window, dtype=torch.float).unsqueeze(-1)  # Shape: [window_size, 1]
        # Label: 1 if any point in the window is an anomaly, else 0
        y = torch.tensor(1.0 if window_labels.any() else 0.0, dtype=torch.float)
        return x, y
    def indices(self):
        return self.sample_indices
设置数据集
既然我们已经设计了TimeSeriesAnomalyDataset,现在我们将实例化它并验证时间序列数据集的结构。
重要细节:
- num_pos代表包含异常的窗口的总数
- num_neg代表不包含异常的窗口的总数
- 我们确保检查是否存在包含异常的窗口
dataset = TimeSeriesAnomalyDataset(
    time_series,
    labels,
    window_size=args.window_size,
    step_size=args.step_size,
)
# Verify dataset length and class distribution
print(f"Total samples in dataset: {len(dataset)}")
num_pos = sum([y.item() for _, y in dataset])
num_neg = len(dataset) - num_pos
print(f"Number of positive samples in dataset: {int(num_pos)}")
print(f"Number of negative samples in dataset: {int(num_neg)}")
if num_pos == 0:
    raise ValueError(
        "No positive samples found in the dataset. Adjust window_size or step_size."
    )
分割数据集
在这里,我们将执行分层分割,以使用默认的比例(60%用于训练,20%用于验证,20%用于测试)将时间序列数据分为训练集、验证集和测试集。
def stratified_split(
    dataset, train_ratio=0.6, val_ratio=0.2, test_ratio=0.2, seed=42
):
    labels = [y.item() for _, y in dataset]
    train_val_indices, test_indices = train_test_split(
        np.arange(len(labels)),
        test_size=test_ratio,
        stratify=labels,
        random_state=seed,
    )
    val_relative_ratio = val_ratio / (train_ratio + val_ratio)
    train_indices, val_indices = train_test_split(
        train_val_indices,
        test_size=val_relative_ratio,
        stratify=[labels[i] for i in train_val_indices],
        random_state=seed,
    )
    return train_indices, val_indices, test_indices
train_indices, val_indices, test_indices = stratified_split(dataset, seed=args.seed)
print(
    f"Train samples: {len(train_indices)}, Val samples: {len(val_indices)}, Test samples: {len(test_indices)}"
)
验证异常
在本节中,我们将统计每组数据中的异常数量。
# Count anomalies in each set
def count_anomalies(dataset_subset, name):
    labels = [y.item() for _, y in dataset_subset]
    num_anomalies = int(sum(labels))
    num_normals = len(labels) - num_anomalies
    print(f"{name} - Anomalies: {num_anomalies}, Normals: {num_normals}")
train_dataset = torch.utils.data.Subset(dataset, train_indices)
val_dataset = torch.utils.data.Subset(dataset, val_indices)
test_dataset = torch.utils.data.Subset(dataset, test_indices)
count_anomalies(train_dataset, "Train")
count_anomalies(val_dataset, "Validation")
count_anomalies(test_dataset, "Test")
平衡数据集
异常通常是罕见的,这会导致类别不平衡。
我们使用SMOTE(合成少数类过采样技术)来平衡数据集。
SMOTE(合成少数类过采样技术)是一种用于解决数据集中类别不平衡问题的技术。当一个类别的实例数量显著多于另一个类别时,模型可能会偏向多数类。
SMOTE的工作原理:
- 合成样本生成:SMOTE通过在现有的少数类实例之间进行插值来生成少数类的合成样本。
- K-最近邻:对于每个少数类实例,SMOTE选择其k个最近邻中的一个,并沿着连接它们的线创建一个合成点。
- 平衡数据集:通过添加合成样本,SMOTE平衡了类别分布,使模型能够有效地从两个类别中学习。
然后,我们创建一个与Pytorch的DataLoader兼容的ResampledDataset类。在此之后,我们验证SMOTE之后的新类别分布。
X_train = [x.numpy().flatten() for x, _ in train_dataset]
y_train = [int(y.item()) for _, y in train_dataset]

from imblearn.over_sampling import SMOTE
smote = SMOTE(random_state=args.seed)
X_resampled, y_resampled = smote.fit_resample(X_train, y_train)
class ResampledDataset(torch.utils.data.Dataset):
    def __init__(self, X, y):
        self.X = [torch.tensor(x, dtype=torch.float).view(-1, 1) for x in X]
        self.y = [torch.tensor(label, dtype=torch.float) for label in y]
    def __len__(self):
        return len(self.X)
    def __getitem__(self, idx):
        return self.X[idx], self.y[idx]
balanced_train_dataset = ResampledDataset(X_resampled, y_resampled)
train_loader = torch.utils.data.DataLoader(
    balanced_train_dataset, batch_size=args.batch_size, shuffle=True
)
val_loader = torch.utils.data.DataLoader(
    val_dataset, batch_size=args.batch_size, shuffle=False
)
test_loader = torch.utils.data.DataLoader(
    test_dataset, batch_size=args.batch_size, shuffle=False
)
total_anomalies = y_resampled.count(1)
total_normals = y_resampled.count(0)
print(f"Balanced Training Set - Anomalies: {total_anomalies}, Normals: {total_normals}")
# Adjust the pos_weight for BCEWithLogitsLoss
pos_weight = total_normals / total_anomalies
print(f"Using pos_weight: {pos_weight:.4f}")
定义NaiveFourierKANLayer
在构建KAN之前,我们将定义NaiveFourierKANLayer,它使用傅里叶特征(即正弦和余弦变换,此模型中的“激活函数”)来转换输入数据,从而增强模型捕获复杂时间模式的能力。
在初始化时,该层设置了可学习的傅里叶系数和一个可选的偏置项。
在前向传递过程中,它首先生成一系列频率,并在这些频率上对输入数据应用正弦和余弦变换,从而有效地创建一组丰富的傅里叶特征。
然后,使用学习到的傅里叶系数对这些转换后的特征进行线性组合,以产生具有所需维度的输出。
NaiveFourierKANLayer的分解:
初始化:
- gridsize:要使用的傅里叶频率的数量。
- fouriercoeffs:形状为[2 * gridsize, inputdim, outdim]的可学习参数。其中的2考虑了正弦和余弦分量。
- 归一化:系数使用缩放因子进行初始化,以保持梯度的稳定性。
前向传递:
- 输入形状:x的形状为[batch_size, window_size, inputdim]。
- 频率范围 (k):我们创建一个从1到gridsize的频率张量。可以理解为k=[1,2,…,gridsize]。
计算角度:
θ = x × k × π,按以下方式计算:
angles = x_expanded * k * np.pi
- 广播确保每个输入维度都乘以每个频率。
计算傅里叶特征:
sin_features = sin(θ),按以下方式计算:
sin_features = torch.sin(angles)
cos_features = cos(θ),按以下方式计算:
cos_features = torch.cos(angles)
连接特征:
- 我们沿着频率维度连接正弦和余弦特征,得到一个形状为[batch_size, window_size, inputdim, 2 * gridsize]的特征张量。
重塑以进行矩阵乘法:
展平批处理和窗口维度,为矩阵乘法做准备:[batch_size * window_size, inputdim, 2 * gridsize]。
矩阵乘法:
使用爱因斯坦求和(torch.einsum)执行矩阵乘法y = features ⋅ fouriercoeffs
该操作计算:

结果y的形状为[batch_size * window_size, outdim]。
重塑回原形状:
将y重塑回[batch_size, window_size, outdim]的形状。
添加偏置项:
如果addbias为True,则添加偏置项。
输出张量的形状为[batch_size, window_size, outdim],表示每个窗口中每个时间步的转换特征,这些特征富含了基于频率的信息。
class NaiveFourierKANLayer(nn.Module):
    def __init__(self, inputdim, outdim, gridsize=50, addbias=True):
        super(NaiveFourierKANLayer, self).__init__()
        self.gridsize = gridsize
        self.addbias = addbias
        self.inputdim = inputdim
        self.outdim = outdim
        self.fouriercoeffs = nn.Parameter(
            torch.randn(2 * gridsize, inputdim, outdim)
            / (np.sqrt(inputdim) * np.sqrt(gridsize))
        )
        if self.addbias:
            self.bias = nn.Parameter(torch.zeros(outdim))
    def forward(self, x):
        # x shape: [batch_size, window_size, inputdim]
        batch_size, window_size, inputdim = x.size()
        k = torch.arange(1, self.gridsize + 1, device=x.device).float()
        k = k.view(1, 1, 1, self.gridsize)
        x_expanded = x.unsqueeze(-1)  # [batch_size, window_size, inputdim, 1]
        angles = x_expanded * k * np.pi  # [batch_size, window_size, inputdim, gridsize]
        sin_features = torch.sin(angles)
        cos_features = torch.cos(angles)
        features = torch.cat([sin_features, cos_features], dim=-1)  # Concatenate on gridsize dimension
        features = features.view(batch_size * window_size, inputdim, -1)  # Flatten for matmul
        coeffs = self.fouriercoeffs  # [2 * gridsize, inputdim, outdim]
        y = torch.einsum('bik,kio->bo', features, coeffs)
        y = y.view(batch_size, window_size, self.outdim)
        if self.addbias:
            y += self.bias
        return y
定义KAN
现在我们将定义KAN(可能是指Kernel Attention Network或某种特定的异常检测网络)架构。
以下是概述:
- 输入层:将输入映射到更高维度的隐藏空间。
- KAN层:堆叠多个NaiveFourierKANLayer实例以捕获复杂模式。
- 全局平均池化:聚合时间窗口内的信息。
- 输出层:产生最终的异常得分。
KAN分解:
初始化:
- 输入层(lin_in):从in_feat到hidden_feat的线性变换。
- 批量归一化(bn_in):应用于输入层之后。
- Dropout:正则化以防止过拟合,促进对未见数据的泛化。
隐藏层:
- layers:NaiveFourierKANLayer实例的列表。
- bns:对应的批量归一化层。
- 输出层(lin_out):从hidden_feat到out_feat(本例中为标量输出)的线性变换。将聚合特征映射到标量异常得分,量化窗口包含异常的可能性。
前向传递:
输入变换:
- 将输入x通过输入线性层。
- 应用批量归一化和Leaky ReLU激活函数。
- 应用dropout。
隐藏层(对于每一层):
- 将输出通过NaiveFourierKANLayer。
- 应用批量归一化和激活函数。
- 应用dropout。
全局平均池化:
对window_size维度进行平均,以聚合时间信息。
输出层:
- 将池化后的特征通过输出线性层。
- 输出被压缩以去除不必要的维度。
输出:
- x:形状为[batch_size]的张量,其中每个元素是一个标量,代表批次中相应窗口的异常得分。
- 较高的得分表示窗口包含异常的可能性较高。
class KAN(nn.Module):
    def __init__(
        self,
        in_feat,
        hidden_feat,
        out_feat,
        grid_feat,
        num_layers,
        use_bias=True,
        dropout=0.3,
    ):
        super(KAN, self).__init__()
        self.num_layers = num_layers
        self.lin_in = nn.Linear(in_feat, hidden_feat, bias=use_bias)
        self.bn_in = nn.BatchNorm1d(hidden_feat)
        self.dropout = nn.Dropout(p=dropout)
        self.layers = nn.ModuleList()
        self.bns = nn.ModuleList()
        for _ in range(num_layers):
            self.layers.append(
                NaiveFourierKANLayer(
                    hidden_feat, hidden_feat, grid_feat, addbias=use_bias
                )
            )
            self.bns.append(nn.BatchNorm1d(hidden_feat))
        self.lin_out = nn.Linear(hidden_feat, out_feat, bias=use_bias)
    def forward(self, x):
        # x shape: [batch_size, window_size, 1]
        batch_size, window_size, _ = x.size()
        x = self.lin_in(x)  # [batch_size, window_size, hidden_feat]
        x = self.bn_in(x.view(-1, x.size(-1))).view(batch_size, window_size, -1)
        x = F.leaky_relu(x, negative_slope=0.1)
        x = self.dropout(x)
        for layer, bn in zip(self.layers, self.bns):
            x = layer(x)
            x = bn(x.view(-1, x.size(-1))).view(batch_size, window_size, -1)
            x = F.leaky_relu(x, negative_slope=0.1)
            x = self.dropout(x)
        # Global average pooling over the window dimension
        x = x.mean(dim=1)  # [batch_size, hidden_feat]
        x = self.lin_out(x).squeeze()  # [batch_size]
        return x
定义我们的损失函数:焦点损失(Focal Loss)
对于我们的项目,焦点损失是最适合用来计算异常检测中漏检情况的损失函数。
焦点损失是一种损失函数,旨在通过关注难以分类的样本来解决类别不平衡问题。
异常检测本质上涉及不平衡的数据集,其中异常(正类)明显比正常实例(负类)更为罕见。
这种不平衡对传统的损失函数(如二元交叉熵(BCE))构成了挑战,因为它们可能会被多数类所主导,导致模型偏向于预测多数类而忽视少数(异常)类。
对于二分类问题,焦点损失定义为:

在哪里:

为什么使用焦点损失(Focal Loss)?
- 关注难例:焦点损失的特性能够降低简单负例的权重,同时提高难分正例的权重,确保模型不会偏向于多数类。
- 对异常的高灵敏度:将学习过程聚焦于难以分类的异常上,提高模型检测微妙且罕见异常的能力。
# Implement Focal Loss
class FocalLoss(nn.Module):
    def __init__(self, alpha=0.25, gamma=2, reduction='mean'):
        super(FocalLoss, self).__init__()
        self.alpha = alpha
        self.gamma = gamma
        self.reduction = reduction
    def forward(self, inputs, targets):
        BCE_loss = F.binary_cross_entropy_with_logits(inputs, targets, reduction='none')
        pt = torch.exp(-BCE_loss)
        F_loss = self.alpha * ((1 - pt) ** self.gamma) * BCE_loss
        if self.reduction == 'mean':
            return F_loss.mean()
        else:
            return F_loss.sum()
criterion = FocalLoss(alpha=0.25, gamma=2)
设置训练与评估
既然我们已经设计好了KAN(Kernel Attention Network或特定异常检测网络),现在是时候声明它并设置训练与评估了。
我们将使用Adamas作为优化器,并使用ReduceLROnPlateau作为学习率调度器,当指定的指标停止改进时,它会降低学习率。
我们还将定义evaluate_metrics函数。
我们将跟踪的指标包括:
- 精确率(precision):真正阳性预测数与总阳性预测数的比率,衡量阳性预测的准确性。
- 召回率(recall):真正阳性预测数与实际阳性实例总数的比率,衡量模型捕获所有实际异常的能力。
- F1分数(f1):精确率和召回率的调和平均数(平衡精确率和召回率,提供一个同时考虑假阳性和假阴性的单一指标)。
- ROC AUC值(roc_auc_val):受试者工作特征(ROC)曲线下面积。较高的ROC AUC值表示在区分异常和正常实例方面的整体性能更好。
最后,我们将定义find_optimal_threshold函数,该函数用于确定将预测概率转换为二分类标签(0表示正常,1表示异常)的阈值,以最大化F1分数。
model = KAN(
    in_feat=1,
    hidden_feat=args.hidden_size,
    out_feat=1,
    grid_feat=args.grid_size,
    num_layers=args.n_layers,
    use_bias=True,
    dropout=args.dropout,
).to(args.device)
optimizer = torch.optim.Adam(model.parameters(), lr=args.lr, weight_decay=1e-5)
scheduler = torch.optim.lr_scheduler.ReduceLROnPlateau(
    optimizer, mode='min', factor=0.5, patience=5
)
def evaluate_metrics(true_labels, pred_labels, pred_probs):
    precision = precision_score(true_labels, pred_labels, zero_division=0)
    recall = recall_score(true_labels, pred_labels, zero_division=0)
    f1 = f1_score(true_labels, pred_labels, zero_division=0)
    roc_auc_val = roc_auc_score(true_labels, pred_probs)
    return precision, recall, f1, roc_auc_val
def find_optimal_threshold(probs, labels):
    precision_vals, recall_vals, thresholds = precision_recall_curve(labels, probs)
    f1_scores = 2 * (precision_vals * recall_vals) / (precision_vals + recall_vals + 1e-8)
    optimal_idx = np.argmax(f1_scores)
    if optimal_idx < len(thresholds):
        optimal_threshold = thresholds[optimal_idx]
    else:
        optimal_threshold = 0.5  # Default threshold
    optimal_f1 = f1_scores[optimal_idx]
    return optimal_threshold, optimal_f1
训练
随着模型训练设置的完成,我们开始训练模型。我们有一个训练循环,用于训练模型并监控训练损失和准确性,同时还有一个验证循环,用于监控模型在验证集上的表现。请注意,如果模型没有表现出改进的迹象,我们会采用早停策略。
# Training and validation loop with early stopping
best_val_f1 = 0
patience = args.early_stopping
patience_counter = 0
optimal_threshold = 0.5  # Initialize with default threshold
for epoch in range(args.epochs):
    # Training Phase
    model.train()
    total_loss = 0
    total_acc = 0
    total_preds_pos = 0  # Monitor number of positive predictions
    for x_batch, y_batch in train_loader:
        x_batch = x_batch.to(args.device)
        y_batch = y_batch.to(args.device)
        optimizer.zero_grad()
        out = model(x_batch)  # Output shape: [batch_size]
        loss = criterion(out, y_batch)
        loss.backward()
        # Gradient clipping
        torch.nn.utils.clip_grad_norm_(model.parameters(), max_norm=1.0)
        optimizer.step()
        total_loss += loss.item() * x_batch.size(0)
        probs = torch.sigmoid(out)
        preds = (probs > 0.5).float()
        acc = (preds == y_batch).float().mean().item()
        total_acc += acc * x_batch.size(0)
        total_preds_pos += preds.sum().item()
    avg_loss = total_loss / len(balanced_train_dataset)
    avg_acc = total_acc / len(balanced_train_dataset)
    print(f"Epoch {epoch+1}, Training Positive Predictions: {total_preds_pos}")
    # Validation Phase
    model.eval()
    val_loss = 0
    val_acc = 0
    all_true = []
    all_preds = []
    all_probs = []
    with torch.no_grad():
        for x_batch, y_batch in val_loader:
            x_batch = x_batch.to(args.device)
            y_batch = y_batch.to(args.device)
            out = model(x_batch)
            loss = criterion(out, y_batch)
            val_loss += loss.item() * x_batch.size(0)
            probs = torch.sigmoid(out)
            preds = (probs > 0.5).float()
            acc = (preds == y_batch).float().mean().item()
            val_acc += acc * x_batch.size(0)
            all_true.extend(y_batch.cpu().numpy())
            all_preds.extend(preds.cpu().numpy())
            all_probs.extend(probs.cpu().numpy())
    avg_val_loss = val_loss / len(val_dataset)
    avg_val_acc = val_acc / len(val_dataset)
    precision, recall, f1, roc_auc_val = evaluate_metrics(all_true, all_preds, all_probs)
    # Find Optimal Threshold
    current_threshold, current_f1 = find_optimal_threshold(all_probs, all_true)
    print(
        f"Epoch: {epoch+1:04d}, "
        f"Train Loss: {avg_loss:.4f}, Train Acc: {avg_acc:.4f}, "
        f"Val Loss: {avg_val_loss:.4f}, Val Acc: {avg_val_acc:.4f}, "
        f"Precision: {precision:.4f}, Recall: {recall:.4f}, "
        f"F1: {f1:.4f}, ROC AUC: {roc_auc_val:.4f}, "
        f"Optimal Threshold: {current_threshold:.4f}, Val F1: {current_f1:.4f}"
    )
    # Step the scheduler
    scheduler.step(avg_val_loss)
    # Early Stopping
    if f1 > best_val_f1:
        best_val_f1 = f1
        patience_counter = 0
        optimal_threshold = current_threshold  # Update optimal threshold
        # Save the best model
        torch.save(model.state_dict(), "best_kan_model.pth")
    else:
        patience_counter += 1
        if patience_counter >= patience:
            print("Early stopping triggered.")
            break
测试
在测试阶段,我们加载在验证集上表现最佳的模型,并在测试集上对其进行评估。
model.load_state_dict(torch.load("best_kan_model.pth"))
model.eval()
test_loss = 0
test_acc = 0
all_true_test = []
all_preds_test = []
all_probs_test = []
with torch.no_grad():
    for x_batch, y_batch in test_loader:
        x_batch = x_batch.to(args.device)
        y_batch = y_batch.to(args.device)
        out = model(x_batch)
        loss = criterion(out, y_batch)
        test_loss += loss.item() * x_batch.size(0)
        probs = torch.sigmoid(out)
        preds = (probs > optimal_threshold).float()
        acc = (preds == y_batch).float().mean().item()
        test_acc += acc * x_batch.size(0)
        all_true_test.extend(y_batch.cpu().numpy())
        all_preds_test.extend(preds.cpu().numpy())
        all_probs_test.extend(probs.cpu().numpy())
avg_test_loss = test_loss / len(test_dataset)
avg_test_acc = test_acc / len(test_dataset)
precision, recall, f1, roc_auc_val = evaluate_metrics(
    all_true_test, all_preds_test, all_probs_test
)
print(
    f"\nTest Loss: {avg_test_loss:.4f}, Test Acc: {avg_test_acc:.4f}, "
    f"Precision: {precision:.4f}, Recall: {recall:.4f}, "
    f"F1: {f1:.4f}, ROC AUC: {roc_auc_val:.4f}"
)
可视化
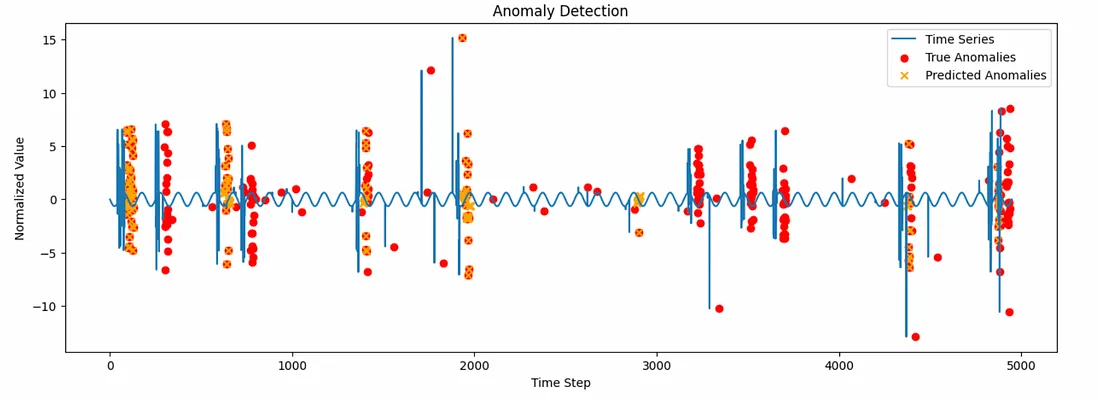
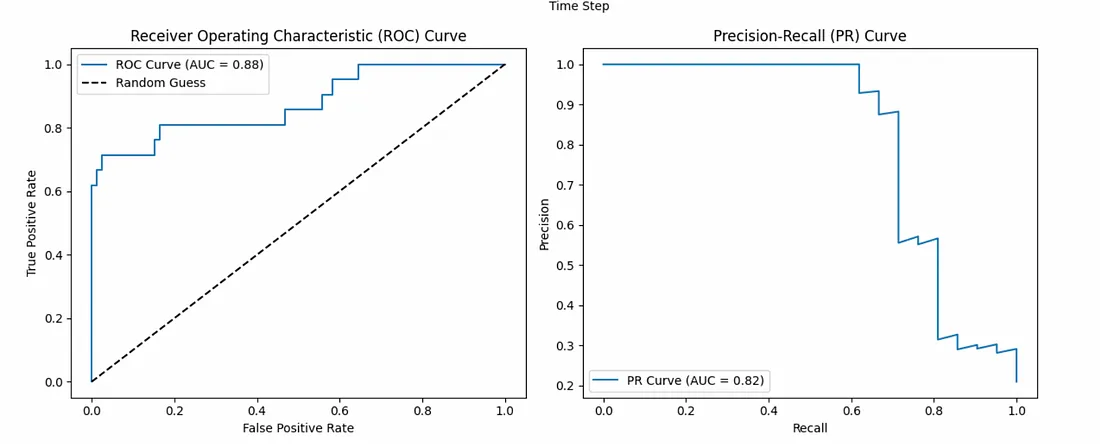
最后,我们编写函数来可视化异常检测测试。plot_anomalies函数创建时间序列可视化,其中红色曲线表示真正的异常,黄色“X”表示模型预测为异常的位置。aggregate_predictions函数将时间序列窗口上的预测结果进行汇总,以与原始时间序列对齐。plot_metrics函数绘制ROC曲线和精确率-召回率曲线,以可视化模型的性能。
def plot_anomalies(time_series, labels, preds, start=0, end=1000):
    plt.figure(figsize=(15, 5))
    plt.plot(time_series[start:end], label="Time Series")
    plt.scatter(
        np.arange(start, end)[labels[start:end] == 1],
        time_series[start:end][labels[start:end] == 1],
        color="red",
        label="True Anomalies",
    )
    plt.scatter(
        np.arange(start, end)[preds[start:end] == 1],
        time_series[start:end][preds[start:end] == 1],
        color="orange",
        marker="x",
        label="Predicted Anomalies",
    )
    plt.legend()
    plt.title("Anomaly Detection")
    plt.xlabel("Time Step")
    plt.ylabel("Normalized Value")
    plt.show()
def aggregate_predictions(indices, preds, window_size, total_length):
    aggregated = np.zeros(total_length, dtype=float)
    counts = np.zeros(total_length, dtype=float)
    for idx, pred in zip(indices, preds):
        start = idx
        end = idx + window_size
        if end > total_length:
            end = total_length
        aggregated[start:end] += pred
        counts[start:end] += 1
    counts[counts == 0] = 1
    averaged = aggregated / counts
    return (averaged > 0.5).astype(int)

plot_metrics(all_true_test, all_probs_test)
test_sample_indices = [dataset.sample_indices[i] for i in test_indices]
aggregated_preds = aggregate_predictions(
    test_sample_indices, all_preds_test, args.window_size, len(time_series)
)
def plot_metrics(true_labels, pred_probs):
    # ROC Curve
    fpr, tpr, _ = roc_curve(true_labels, pred_probs)
    roc_auc_val = auc(fpr, tpr)
    # Precision-Recall Curve
    precision_vals, recall_vals, _ = precision_recall_curve(true_labels, pred_probs)
    pr_auc_val = auc(recall_vals, precision_vals)
    plt.figure(figsize=(12, 5))
    # ROC Curve
    plt.subplot(1, 2, 1)
    plt.plot(fpr, tpr, label=f"ROC Curve (AUC = {roc_auc_val:.2f})")
    plt.plot([0, 1], [0, 1], "k--", label="Random Guess")
    plt.xlabel("False Positive Rate")
    plt.ylabel("True Positive Rate")
    plt.title("Receiver Operating Characteristic (ROC) Curve")
    plt.legend()
    # Precision-Recall Curve
    plt.subplot(1, 2, 2)
    plt.plot(recall_vals, precision_vals, label=f"PR Curve (AUC = {pr_auc_val:.2f})")
    plt.xlabel("Recall")
    plt.ylabel("Precision")
    plt.title("Precision-Recall (PR) Curve")
    plt.legend()
    plt.tight_layout()
    plt.show()
# Plot anomalies on the test set
test_start = min(test_sample_indices)
test_end = max(test_sample_indices) + args.window_size
plot_anomalies(time_series, labels, aggregated_preds, start=test_start, end=test_end)
结果
运行此模型的最终结果显示,在时间序列中检测异常的准确率为91%。
精确率达到1.0,意味着所有预测为异常的实例都是真正的异常。
召回率为0.57,表明模型确实遗漏了相当一部分的异常。
总体而言,在这个例子中,KAN展现出了在时间序列中检测真正异常的巨大潜力,但为了提高其召回率,还需要进一步的改进。


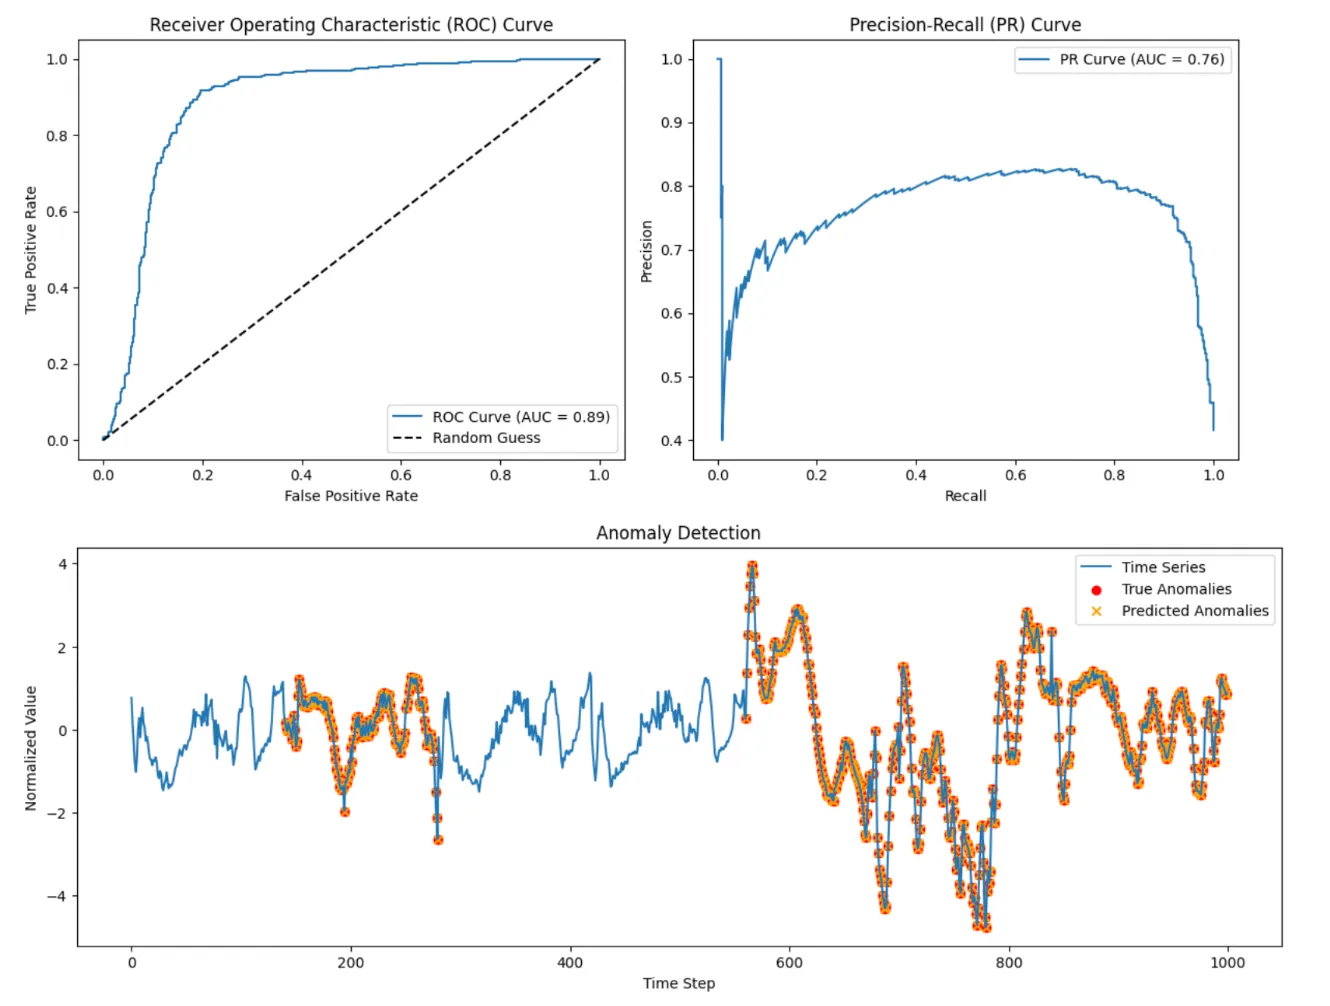
对于ECG5000数据集(本文中未展示),该模型表现出82%的准确率、72%的精确率和93%的召回率,这证明了该模型在保持合理错误率的同时,具有强大的异常检测能力。

结论
在本文中,我们探讨了如何使用Kolmogorov-Arnold网络(KAN)进行时间序列异常检测。我们深入探讨了其理论基础,提供了详细的实现方法,并用数学公式解释了代码的每个组成部分。通过这个实验,Kolmogorov-Arnold神经网络已显示出在有效检测时间序列数据中的异常方面的潜力。凭借其高水平的准确率和精确率,KAN的特性在异常检测中发挥了有效作用。


