利用NetworkX导航网络:Python图形指南
在一个充满连接的世界里,从社交媒体上的友谊到复杂的交通网络,理解关系和模式是理解我们周围系统的关键。想象一下,一个社交网络,其中每个人都是一个点(“节点”),通过线(或“边”)与朋友相连。或者,想象一下绘制一个城市的地铁系统图,其中每个站点都是一个节点,每条路线都是连接它们的边。
这就是NetworkX的优势所在,它提供了一种强大的方式来构建、分析和可视化这些错综复杂的关系网。
NetworkX允许我们以传统表格方式难以处理甚至无法实现的方式来表示数据,但在图形格式中却变得简单而自然。在电子表格中需要许多行和列来定义的关系,可以通过直观、可视化的方式捕捉,帮助我们理解和解释复杂数据。
这个库让我们能够对这些图应用广泛的方法和算法,每次我们用新的方法重新构建数据时,都能提供新的见解。
NetworkX简介
首先,让我们来分解一下什么是图。在网络分析中,图由节点(或顶点)和边(或链接)组成。
- 可以把节点想象成主要实体,比如人或网页,而边则是它们之间的连接——就像社交网络中的友谊或网站之间的超链接。
- 有些边甚至带有权重,表示两个节点之间连接的强度、距离或成本。这一层额外的信息帮助我们不仅分析两个节点是否相连,还能分析它们连接的强度或紧密程度。
这些图可以用来模拟各种各样的系统,从社交网络到分子再到交通网格。
首先,让我们来看看如何使用networkx创建一个图。如果你还没有安装它,请先运行以下命令进行安装:
$ pip install networkx
创建图
为了构建网络,我们将执行以下步骤:
- 初始化网络:通过G = nx.Graph()创建一个图。
- 添加带有属性的节点:使用G.add_node()添加节点,每个节点都可以存储自定义属性,如标签或年龄。
- 添加边:通过G.add_edge()连接节点,每条边都可以包含一个权重属性,以表示连接的强度或成本。
- 可视化图:使用Matplotlib函数,如nx.draw()和nx.draw_networkx_edge_labels()来显示图,展示节点标签和边权重,便于解释。
以下是实现这一过程的代码:
import networkx as nx
import matplotlib.pyplot as plt
# Create a simple graph
G = nx.Graph()
# Add nodes with attributes (e.g., 'label' and 'age')
G.add_node(1, label="A", age=25)
G.add_node(2, label="B", age=30)
G.add_node(3, label="C", age=22)
G.add_node(4, label="D", age=28)
# Add weighted edges (node1, node2, weight)
G.add_edge(1, 2, weight=4)
G.add_edge(1, 3, weight=3)
G.add_edge(2, 4, weight=5)
# Retrieve and print node attributes
node_attributes = nx.get_node_attributes(G, 'age')  # Get 'age' attribute for all nodes
print("Node Attributes (Age):", node_attributes)
# Retrieve and print edge attributes
edge_weights = nx.get_edge_attributes(G, 'weight')  # Get 'weight' attribute for all edges
print("Edge Attributes (Weight):", edge_weights)
# Draw the graph with node and edge attributes
pos = nx.spring_layout(G)  # Layout for node positions
node_labels = nx.get_node_attributes(G, 'label')  # Get node labels for visualization
edge_labels = nx.get_edge_attributes(G, 'weight')  # Get edge weights for visualization
plt.figure(figsize=(6, 6))
nx.draw(G, pos, with_labels=True, node_color='skyblue', font_size=15, font_weight='bold', node_size=500)
# Draw the edge weights and node labels
nx.draw_networkx_edge_labels(G, pos, edge_labels=edge_labels)

plt.title("NetworkX Graph with Node and Edge Attributes")
plt.show()
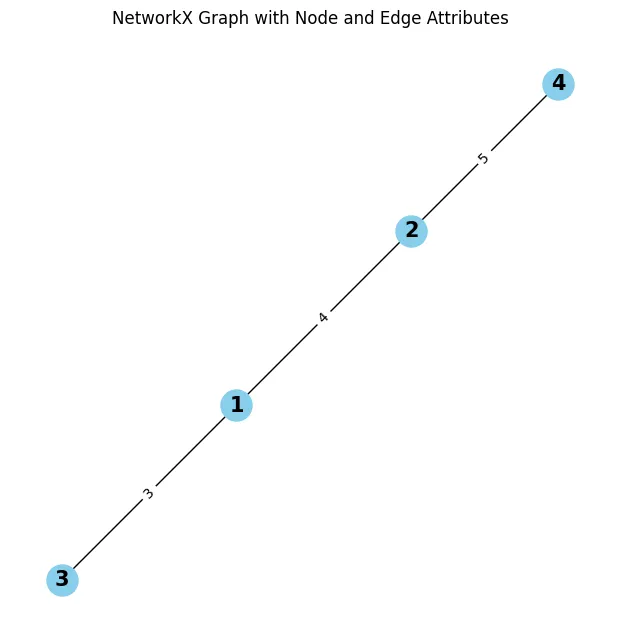
在这个例子中,我们初始化了图,然后创建了:
- 4个节点(1, 2, 3, 4),通过调用G.add_node(node, label, attr)实现;
- 3条带权重的边,连接这些节点:(1, 2)、(1, 3)和(2, 4),通过调用G.add_edge(node1, node2, attr)实现。
在NetworkX中,节点和边都可以附加额外的属性,从而使图包含更丰富的信息。
- 节点属性(通过nx.get_node_attributes(G, 'attribute')访问)允许每个节点存储数据,例如社交网络中某人的职业。
- 边属性(通过nx.get_edge_attributes(G, 'attribute')访问)为每条连接存储信息,如交通网络中的距离或旅行时间。这些属性增加了上下文和深度,使得对网络的分析更加详细。
然后,我们使用NetworkX的弹簧布局pos = nx.spring_layout(G)来确定节点的位置,以便可视化,确保它们在图中自然分布。最后,nx.draw()和nx.draw_networkx_edge_labels()显示带有节点标签和边权重的图,从而清晰地展示出网络的结构和连接。
虽然这是一个相当简单的网络,但它说明了处理网络的基本原理:要操作图,我们需要处理节点及其连接,以及它们可能具有的任何属性。
空手道俱乐部网络
网络科学中最著名的例子之一是Zachary的空手道俱乐部,它经常被用来阐述社交网络分析和社区检测。这个数据集是公开的,并且默认包含在NetworkX中。你可以通过以下方式访问它:
# Load the  Karate Club
G = nx.karate_club_graph()
# Draw the graph
plt.figure(figsize=(8, 8))
pos = nx.spring_layout(G)  # Layout for nodes -> treats nodes as repelling objects
nx.draw(G, pos, with_labels=True, node_color='skyblue', font_size=12, font_weight='bold', node_size=500)
plt.title("Zachary's Karate Club Network")
plt.show()
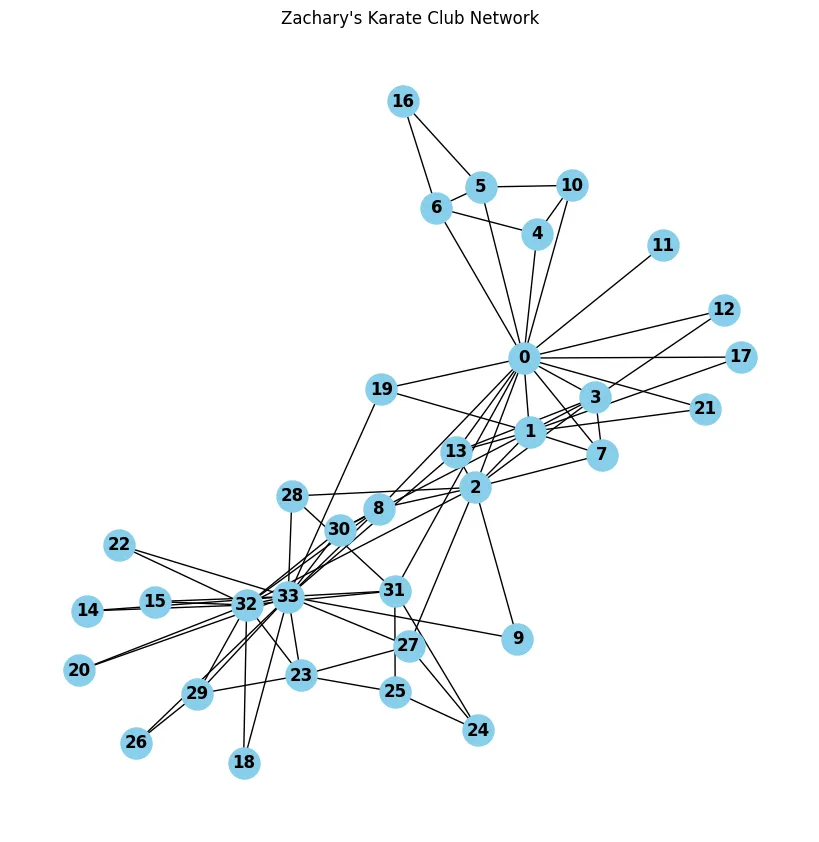
这个网络代表了空手道俱乐部34名成员之间的友谊关系,并且它因两个派系之间的分裂而著名,每个派系都围绕着一个核心人物——Hi先生和Officer。
让我们来看看节点数据中包含的属性:
# looping over nodes
for node in G.nodes():
    print(f"Node: {node}, Node Attributes: {G.nodes[node]}")
Node: 0, Node Attributes: {'club': 'Mr. Hi'}
Node: 1, Node Attributes: {'club': 'Mr. Hi'}
Node: 2, Node Attributes: {'club': 'Mr. Hi'}
Node: 3, Node Attributes: {'club': 'Mr. Hi'}
Node: 4, Node Attributes: {'club': 'Mr. Hi'}
Node: 5, Node Attributes: {'club': 'Mr. Hi'}
Node: 6, Node Attributes: {'club': 'Mr. Hi'}
Node: 7, Node Attributes: {'club': 'Mr. Hi'}
Node: 8, Node Attributes: {'club': 'Mr. Hi'}
Node: 9, Node Attributes: {'club': 'Officer'}
Node: 10, Node Attributes: {'club': 'Mr. Hi'}
Node: 11, Node Attributes: {'club': 'Mr. Hi'}
Node: 12, Node Attributes: {'club': 'Mr. Hi'}
Node: 13, Node Attributes: {'club': 'Mr. Hi'}
Node: 14, Node Attributes: {'club': 'Officer'}
Node: 15, Node Attributes: {'club': 'Officer'}
Node: 16, Node Attributes: {'club': 'Mr. Hi'}
Node: 17, Node Attributes: {'club': 'Mr. Hi'}
Node: 18, Node Attributes: {'club': 'Officer'}
Node: 19, Node Attributes: {'club': 'Mr. Hi'}
Node: 20, Node Attributes: {'club': 'Officer'}
Node: 21, Node Attributes: {'club': 'Mr. Hi'}
Node: 22, Node Attributes: {'club': 'Officer'}
Node: 23, Node Attributes: {'club': 'Officer'}
Node: 24, Node Attributes: {'club': 'Officer'}
Node: 25, Node Attributes: {'club': 'Officer'}
Node: 26, Node Attributes: {'club': 'Officer'}
Node: 27, Node Attributes: {'club': 'Officer'}
Node: 28, Node Attributes: {'club': 'Officer'}
Node: 29, Node Attributes: {'club': 'Officer'}
Node: 30, Node Attributes: {'club': 'Officer'}
Node: 31, Node Attributes: {'club': 'Officer'}
Node: 32, Node Attributes: {'club': 'Officer'}
Node: 33, Node Attributes: {'club': 'Officer'}
节点属性club指的是每个节点所属的社区,即“Officer”或“Mr. Hi”。让我们使用这些属性来为图中的节点着色。
为此,我们在一个名为color_map的列表中,将club标签为“Mr Hi”的节点分配蓝色,将标签为“Officer”的节点分配红色。然后,我们可以使用这个color_map来通过nx.draw可视化网络。
# Load the Karate Club
G: nx.Graph = nx.karate_club_graph()
# Get the node labels
labels = nx.get_node_attributes(G, 'club')
# Map community labels to colors
color_map = []
for node in G.nodes():
    if labels[node] == 'Mr. Hi':
        # Assign blue color for 'Mr. Hi'
        color_map.append('blue')
    else:
        # Assign red color for 'Officer'
        color_map.append('red')
# Visualize the graph
plt.figure(figsize=(8, 8))
pos = nx.spring_layout(G)
nx.draw(G, pos, with_labels=True, node_color=color_map, font_size=12, font_weight='bold', node_size=500, cmap=plt.cm.rainbow)
plt.title("Zachary's Karate Club Network with Ground Truth Communities")
plt.show()
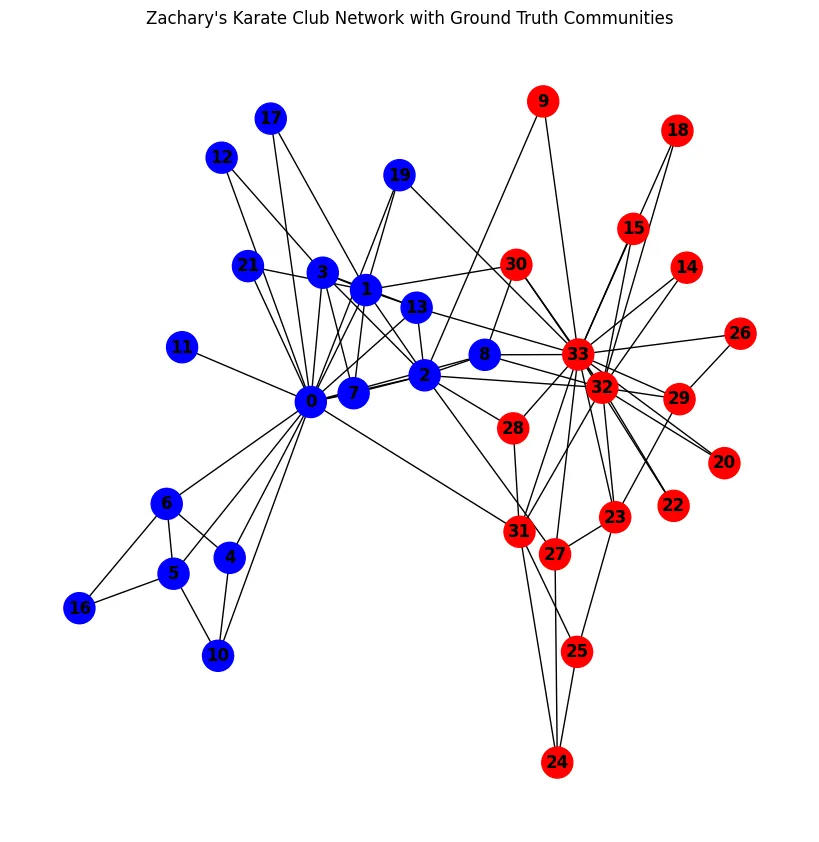
传说俱乐部的教练“Hi先生”和俱乐部的管理员“Officer”之间产生了冲突。这种分歧最终导致俱乐部分裂成两个截然不同的团体,每个团体都围绕其中一位领导者。
通过将这些关系表示为网络,我们可以直观地捕捉到这种分裂,并揭示数据中的模式和集群——这些见解在传统表格格式的数据中可能难以发现。
中心性
为了理解网络的结构和动态,识别最具影响力或战略位置的节点至关重要。这就是中心性度量的用武之地,它是网络科学中的一个关键概念。
中心性度量基于节点的连接类型来评估节点的位置,并根据某些标准识别关键节点。常见的度量方法包括:
- 度中心性(仅仅是每个节点拥有的连接数量)
- 接近中心性(一个节点能够多快地访问网络中的所有其他节点)
- 中介中心性(一个节点在其他节点之间的最短路径上出现的频率)
这些度量方法有助于揭示网络中的关键参与者或瓶颈,从而深入了解网络的结构和动态。
import networkx as nx
import matplotlib.pyplot as plt
# Load the Karate Club
G = nx.karate_club_graph()
# Compute centrality measures
degree_centrality = nx.degree_centrality(G)
betweenness_centrality = nx.betweenness_centrality(G)
closeness_centrality = nx.closeness_centrality(G)
# top 5 nodes by centrality for each measure
top_degree_nodes = sorted(degree_centrality, key=degree_centrality.get, reverse=True)[:5]
top_betweenness_nodes = sorted(betweenness_centrality, key=betweenness_centrality.get, reverse=True)[:5]
top_closeness_nodes = sorted(closeness_centrality, key=closeness_centrality.get, reverse=True)[:5]
# top 5 nodes for each centrality measure
print("Top 5 nodes by Degree Centrality:", top_degree_nodes)
print("Top 5 nodes by Betweenness Centrality:", top_betweenness_nodes)
print("Top 5 nodes by Closeness Centrality:", top_closeness_nodes)
# top 5 nodes for Degree Centrality
plt.figure(figsize=(8, 8))
pos = nx.spring_layout(G)  # Positioning of nodes
node_color = ['red' if node in top_degree_nodes else 'skyblue' for node in G.nodes()]
# draw top 5 nodes by degree centrality
nx.draw(G, pos, with_labels=True, node_color=node_color, font_size=15, font_weight='bold', node_size=500)
plt.title("Karate Club Network with Top 5 Degree Central Nodes")
plt.show()
Top 5 nodes by Degree Centrality: [33, 0, 32, 2, 1]
Top 5 nodes by Betweenness Centrality: [0, 33, 32, 2, 31]
Top 5 nodes by Closeness Centrality: [0, 2, 33, 31, 8]
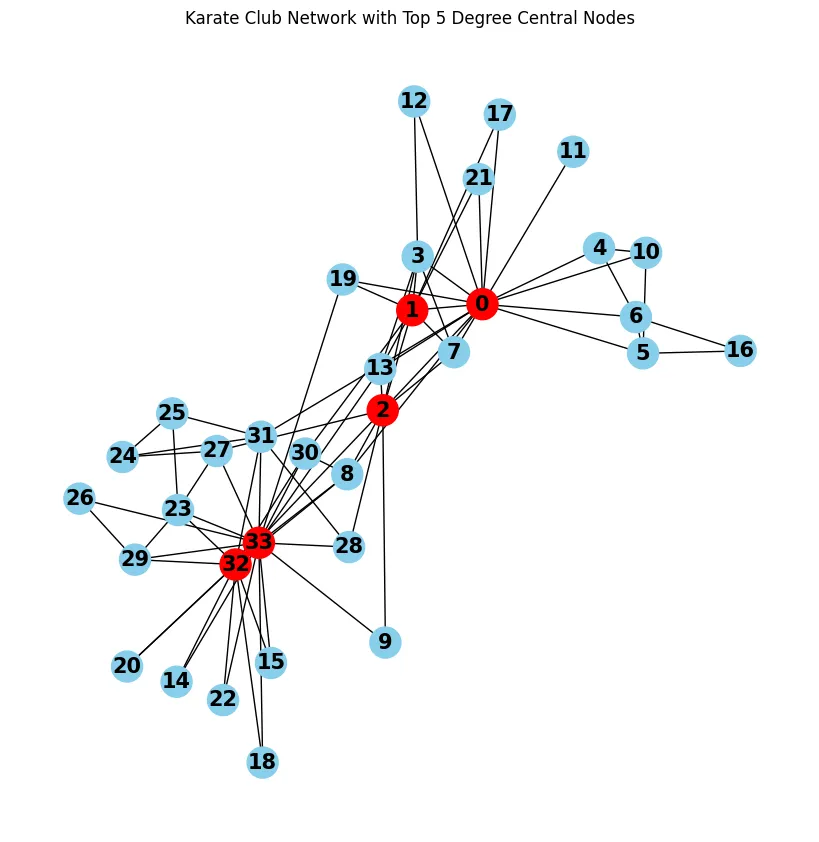
对于节点0和3,我们看到它们是网络中中心性最强的节点,具有高度的度中心性、中介中心性和接近中心性。
它们的核心角色表明它们是连接良好的枢纽,经常作为其他成员之间的桥梁,并且能够快速到达网络中的其他节点。这种位置使它们成为关键角色,在网络流动和结构中具有重要意义。
使用Girvan-Newman算法进行社区检测
社区C是一组节点(例如,社交网络中的个人、通过超链接连接的网页等),它们之间的连接比与网络其余部分的连接更强。
在考虑到中心性的可视化表示后,让我们对这个图应用Girvan-Newman算法。
- 该算法通过逐步移除具有最高中介中心性的边,生成一系列社区分裂。
- 第一次运行算法时,它会识别出最重要的社区分割。
from networkx.algorithms.community import girvan_newman
# Load the Karate Club graph
G = nx.karate_club_graph()
# Apply Girvan-Newman community detection
comp = girvan_newman(G)
first_level_communities = next(comp)
# Visualize the first level of communities
pos = nx.spring_layout(G)
plt.figure(figsize=(8, 8))
# Color nodes by their community
node_colors = ['skyblue' if node in first_level_communities[0] else 'orange' for node in G.nodes()]
nx.draw(G, pos, with_labels=True, node_color=node_colors, font_size=12, node_size=500)
plt.title("Karate Club Network with Girvan-Newman Communities")
plt.show()
print("Detected Communities:", first_level_communities)
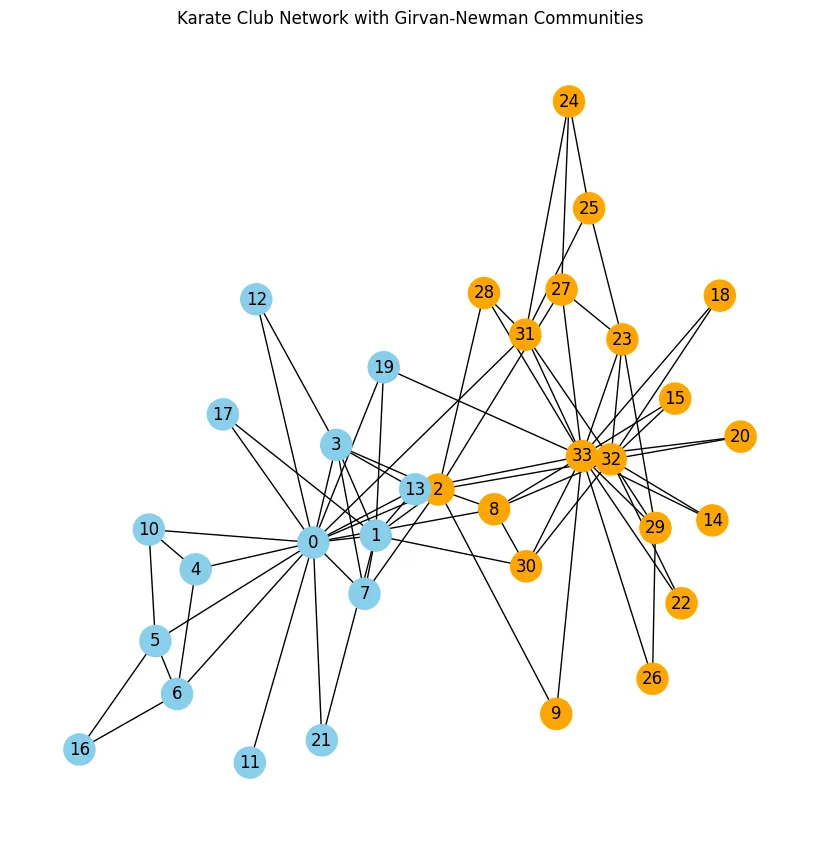
- 由于girvan_newman(G)返回一个迭代器作为comp,调用next(comp)可以让你检索到第一次分裂,即网络首次被划分为两个社区。
让我们将检测到的社区与实际节点标签club进行比较。
print("Detected Communities:", first_level_communities)
# Print the actual communities (ground truth)
print("\nActual Communities (Ground Truth):")
mr_hi_nodes = [node for node, label in labels.items() if label == 'Mr. Hi']
officer_nodes = [node for node, label in labels.items() if label == 'Officer']
print(f"Mr. Hi's Community: {mr_hi_nodes}")
print(f"Officer's Community: {officer_nodes}")
Detected Communities: (
{0, 1, 3, 4, 5, 6, 7, 10, 11, 12, 13, 16, 17, 19, 21},
{2, 8, 9, 14, 15, 18, 20, 22, 23, 24, 25, 26, 27, 28, 29, 30, 31, 32, 33}
)
Actual Communities (Ground Truth):
Mr. Hi's Community: [0, 1, 2, 3, 4, 5, 6, 7, 8, 10, 11, 12, 13, 16, 17, 19, 21]
Officer's Community: [9, 14, 15, 18, 20, 22, 23, 24, 25, 26, 27, 28, 29, 30, 31, 32, 33]
Girvan-Newman算法检测到的社区与实际的Hi先生和Officer社区相似,但并不完全一致。这是因为Girvan-Newman算法仅基于边的中介中心性来划分网络,而不依赖于任何预定义的社区标签。
这种方法在缺乏标签的非结构化数据集中尤其有用,因为它可以根据网络的结构属性揭示出有意义的分组。这突出了社区检测中的一个关键考虑因素:对于什么是社区,并没有严格的定义。
因此,没有一种“正确”的方式来划分网络。由不同度量驱动的不同方法可能会产生不同的结果,每种结果都能根据上下文提供有价值的见解。

派系(Cliques)
在网络中,派系是一个有用的概念。在网络科学中,派系指的是图中节点的一个子集,其中该子集中的每个节点都与该子集中的其他所有节点相连。这意味着派系内的所有成员之间都有直接的关系,形成了一个紧密相连的团体。在研究复杂网络的结构时,派系可能特别有用,因为它们通常代表了一个更大系统中高度连接或内聚的团体。
例如:
- 在社交网络中:派系可以代表彼此认识的人群,如紧密的朋友圈或专业同事圈。
- 在合作网络中:在合作网络(如研究合作)中,派系可以揭示在同一主题或项目上合作的研究团队。
- 在生物网络中:在生物网络中,派系可以指示在生物过程中密切相互作用的蛋白质或基因的功能团。
接下来,让我们在空手道俱乐部网络中找到最大的派系。我们将找到彼此之间都有联系的最大人群。
import networkx as nx
import matplotlib.pyplot as plt
# Load the Karate Club graph
G = nx.karate_club_graph()
# Find all cliques in the Karate Club network
cliques = list(nx.find_cliques(G))
# Find the largest clique (the one with the most nodes)
largest_clique = max(cliques, key=len)
# Print the largest clique
print("Largest Clique:", largest_clique)
# Visualize the graph with the largest clique highlighted
plt.figure(figsize=(8, 8))
pos = nx.spring_layout(G)  # Layout for node positions
nx.draw(G, pos, with_labels=True, node_color='skyblue', font_size=12, node_size=500)
# Highlight the nodes in the largest clique
nx.draw_networkx_nodes(G, pos, nodelist=largest_clique, node_color='orange', node_size=500)
plt.title("Karate Club Network with Largest Clique Highlighted")
plt.show()
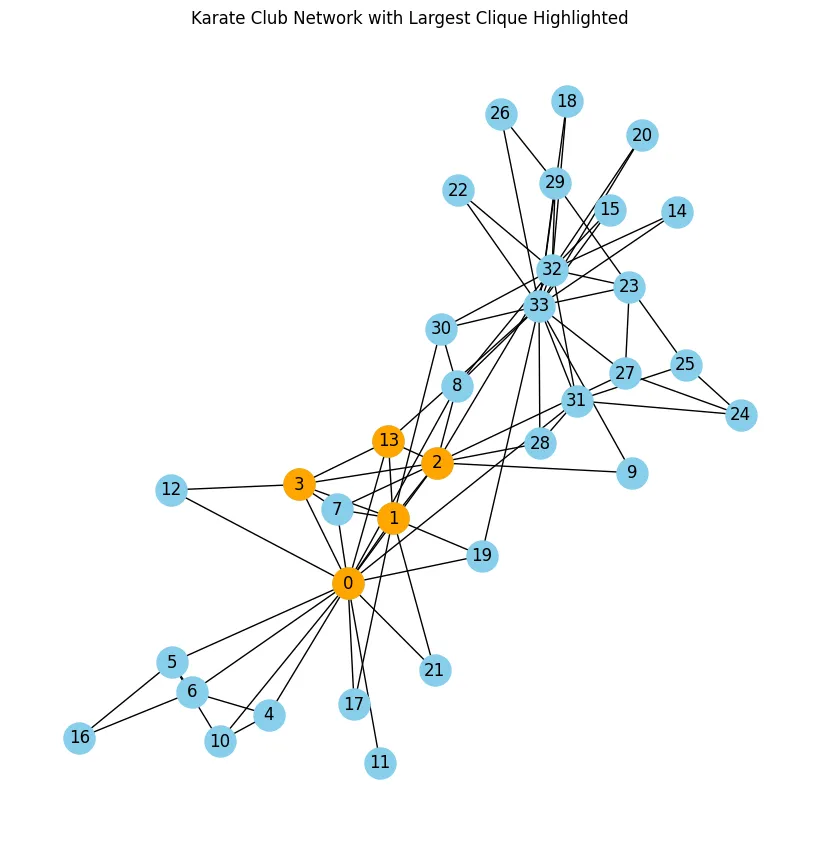
尽管在网络科学中定义“社区”存在挑战,但派系为识别完全互联的团体提供了一个具体且定义明确的概念,为结构化和非结构化网络都提供了有意义的见解。
最短路径
网络科学中的另一个有趣概念是最短路径。图中两个节点之间的最短路径指的是连接这两个节点的边序列,同时使总距离或成本最小化。根据应用场景的不同,这个总距离或成本可以有多种解释。这个概念在路由算法、网络设计、交通规划甚至社交网络分析等领域都发挥着关键作用。
NetworkX提供了多种计算最短路径的算法,如用于加权图的Dijkstra算法和用于无权重图的广度优先搜索(BFS)。

让我们来看一个例子,我们将创建一个合成数据集,其中节点代表站点,边代表站点之间的连接。
我们还将为边添加权重,即时间,表示从一个站点到达下一个站点所需的时间。
import pandas as pd
import networkx as nx
import matplotlib.pyplot as plt
# Simulate loading a CSV file (real example would load an actual CSV file)
# Define a more extensive set of stations and travel times between them
data = {
    'station_id': ['A', 'A', 'B', 'B', 'C', 'C', 'D', 'D', 'E', 'E', 'F', 'F', 'G', 'G', 'H'],
    'connected_station': ['B', 'C', 'A', 'C', 'A', 'D', 'C', 'E', 'B', 'F', 'D', 'G', 'E', 'H', 'F'],
    'time': [10, 20, 10, 15, 20, 10, 5, 15, 10, 25, 10, 5, 15, 10, 30]  # Travel times in minutes
}
# Create a DataFrame
df = pd.DataFrame(data)
# Create a graph from the DataFrame
G = nx.Graph()
# Add edges to the graph (station connections with weights as travel times)
for index, row in df.iterrows():
    G.add_edge(row['station_id'], row['connected_station'], weight=row['time'])
# Draw the graph
plt.figure(figsize=(8, 8))
pos = nx.spring_layout(G)  # Layout for node positions
nx.draw(G, pos, with_labels=True, node_size=500, node_color='skyblue', font_size=12, font_weight='bold')
# Draw edge weights (travel times)
edge_labels = nx.get_edge_attributes(G, 'weight')
nx.draw_networkx_edge_labels(G, pos, edge_labels=edge_labels)
plt.title("Expanded Transportation Network with Travel Times")
plt.show()
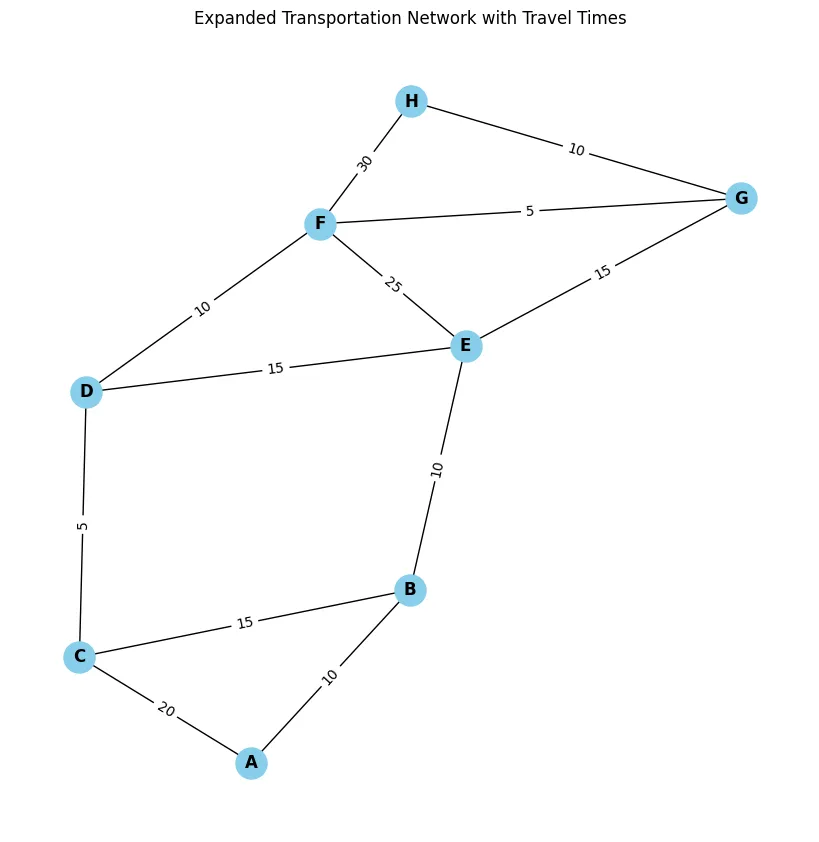
在这个例子中,我们使用Dijkstra算法来计算从站点A到站点H的最短路径,其中边的权重表示旅行时间。最短路径及其总旅行时间会被打印出来,并且为了可视化,路径会在图中用红色高亮显示,同时显示边的权重以指示站点之间的旅行时间。
# Compute the shortest path using Dijkstra's algorithm (considering the travel time as weight)
source = 'A'
target = 'H'
shortest_path = nx.shortest_path(G, source=source, target=target, weight='weight')
path_length = nx.shortest_path_length(G, source=source, target=target, weight='weight')
# Print the shortest path and its length
print(f"Shortest path from {source} to {target}: {shortest_path}")
print(f"Total travel time from {source} to {target}: {path_length} minutes")
# Visualize the shortest path on the graph
plt.figure(figsize=(8, 8))
nx.draw(G, pos, with_labels=True, node_size=500, node_color='skyblue', font_size=12, font_weight='bold')
# Highlight the shortest path in red
edges_in_path = [(shortest_path[i], shortest_path[i + 1]) for i in range(len(shortest_path) - 1)]
nx.draw_networkx_edges(G, pos, edgelist=edges_in_path, edge_color='red', width=2)
# Draw edge weights (travel times)
nx.draw_networkx_edge_labels(G, pos, edge_labels=edge_labels)
plt.title(f"Shortest Path from {source} to {target} with Travel Time {path_length} minutes")
plt.show()
Shortest path from A to H: ['A', 'B', 'E', 'G', 'H']
Total travel time from A to H: 45 minutes
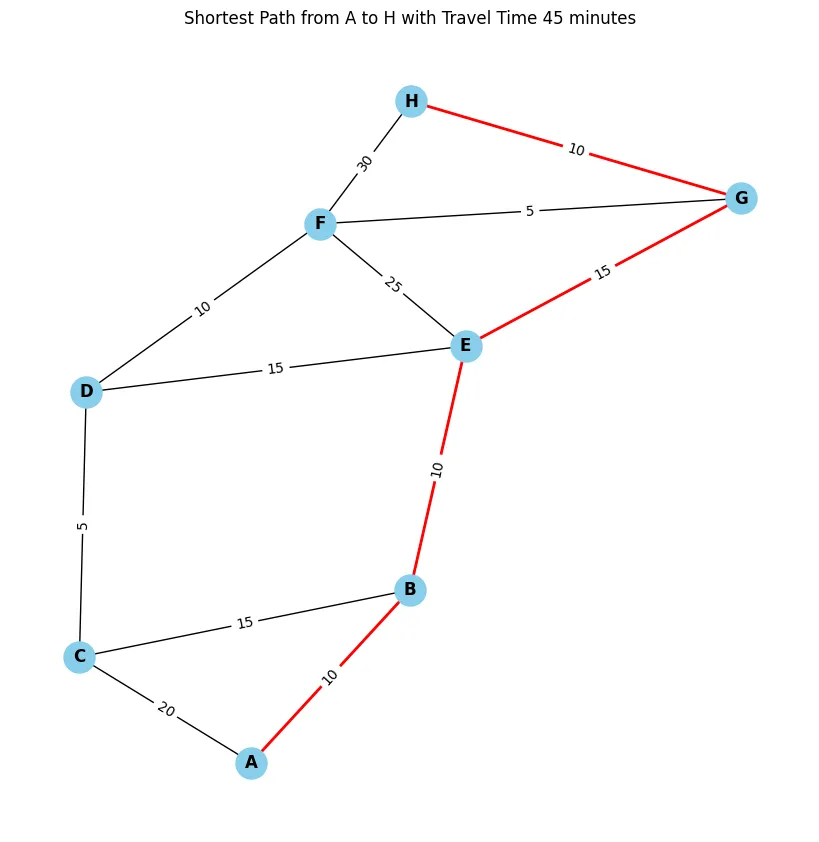
该算法计算出了最短路线及其总旅行时间,并将这些信息显示出来。在图中,A和H之间的最短路径用红色高亮显示,边的权重表示每个相连站点之间的时间,总时间为45。
虽然这只是一个简单的计算,但最短路径算法有着广泛的应用。在交通运输领域,它们能够优化路线并减少旅行时间;在数字通信领域,它们能够高效地路由数据。在物流领域,它们对于降低成本至关重要;在供应链领域,它们能够确保及时交付;在社交网络中,它们能够衡量个体之间的亲近程度。理解最短路径能够在各个领域——从城市规划到网络基础设施——支持基于数据的决策,是高效导航复杂系统的重要工具。


