利用Python和DuckDB提升SQL分析能力
2024年12月06日 由 alex 发表
908
0
这篇文章探讨了Python与DuckDB(一种强大的内存数据库)之间的协同作用,旨在彻底改变基于SQL的数据分析方式。
通过利用Python丰富的数据科学生态系统和DuckDB闪电般的查询执行速度,数据专业人员可以显著加快其工作流程。
我们深入探讨了DuckDB与流行的Python库之间的无缝集成,从而实现高效的数据采集、转换和分析。
通过实际案例,我们展示了如何利用DuckDB的全部潜力来处理复杂的SQL查询、实时数据处理和探索性数据分析。
数据库创建
数据库:retail_db
表:retail_sales
# Import libraries
import polars as pl
import duckdb as db
import plotly.express as px
# Create database
conn = db.connect('retail_db.db')
# Create table
conn.sql('''
    create table if not exists retail_sales (
        id INT,
        sale_date DATE,
        sale_time TIME,
        customer_id INT,
        gender VARCHAR(10),
        age INT,
        category VARCHAR(35),
        quantity INT,
        price_per_unit FLOAT,
        cogs FLOAT,
        total_sale FLOAT
        )
''')
数据摄取
# Insert data into table from csv file
conn.sql('''
    INSERT INTO retail_sales
    SELECT * FROM read_csv('sales.csv')
''')
数据探索与清洗
- 记录计数:确定数据集中的总记录数。
- 客户计数:找出数据集中有多少唯一客户。
- 类别计数:识别数据集中所有唯一的产品类别。
- 空值检查:检查数据集中是否存在任何空值,并删除包含缺失数据的记录。
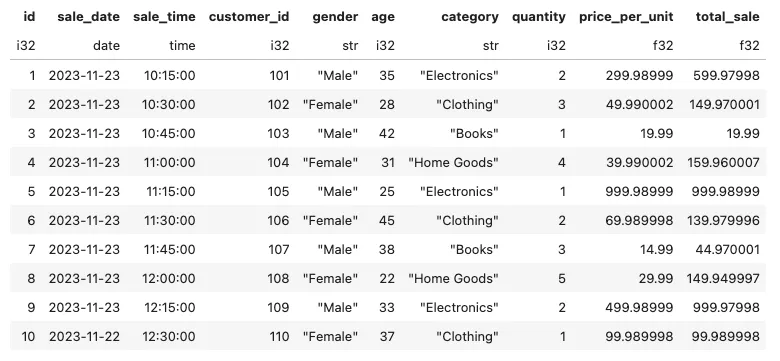
# Show first 10 records
conn.sql('select * exclude(cogs) from retail_sales limit 10').pl()
记录数
conn.sql('select count(*) as records from retail_sales').pl()
客户数
conn.sql('select count(distinct customer_id) customers from retail_sales').pl()
类别数
conn.sql('select distinct category from retail_sales').pl()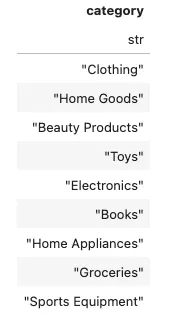
空值检查
conn.table('retail_sales').pl().null_count()
数据分析
编写一个查询语句,检索‘2023–11–23’这一天所有列的销售数据。
conn.sql('''
    select *
        exclude(cogs)
    from retail_sales
    where sale_date = '2023-11-23'
''').pl()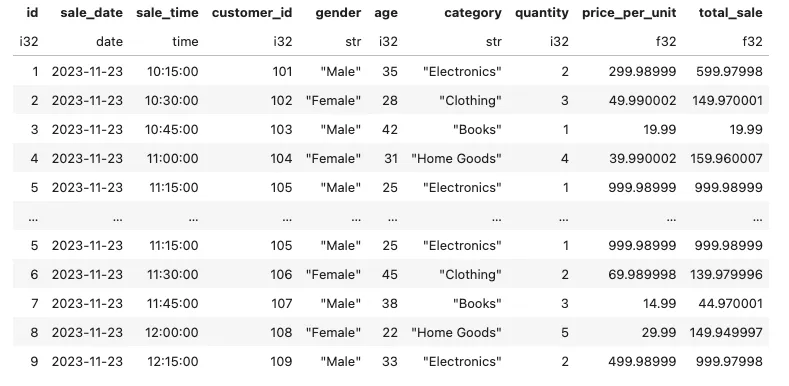
编写一个SQL查询语句,检索2022年11月中类别为“服装”且销售量超过4的所有交易
conn.sql('''
    select *
        exclude(cogs)
    from retail_sales
    where category = 'Clothing'
        and extract('month' from sale_date) = '11'
        and quantity >= 2
''').pl()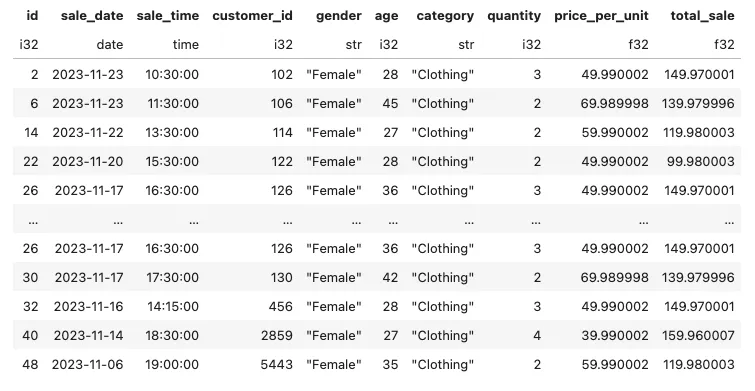
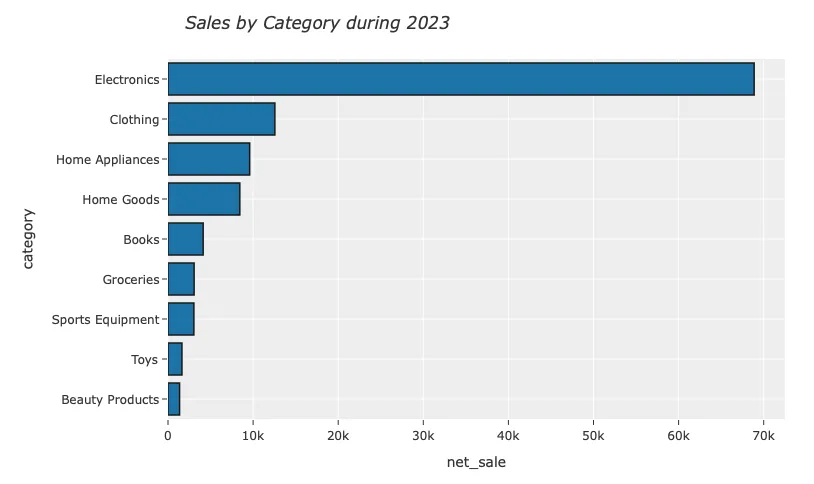
编写一个SQL查询语句,计算每个类别的总销售额。
sales = conn.sql('''
    select
        category
        , round(sum(total_sale),2) as net_sale
        , count(*) as total_orders
    from retail_sales
    group by 1
    order by total_orders desc
''').pl()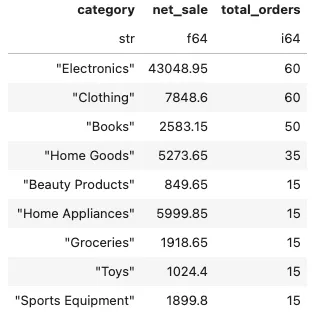
fig = px.bar(sales,
             x="net_sale",
             y="category",
             orientation='h',
             hover_data=['category','net_sale',],
            )
fig.update_layout(width=850,
                  height=500,
                  title_text='<i>Sales by Category during 2023</i>',
                  title_x=0.2,
                  template="ggplot2",
                  yaxis={'categoryorder':'total ascending'}
                 )
fig.show()
编写一个SQL查询语句,查找购买过“服装”类别商品的客户的平均年龄。
conn.sql('''
    select
        round(avg(age), 2) as avg_age
    from retail_sales
    where category = 'Clothing'
''').pl()
编写一个SQL查询语句,查找所有总销售额大于1,000的交易记录。
conn.sql('''
    select *
        exclude(cogs)
    from retail_sales
    where total_sale > 999
''').pl()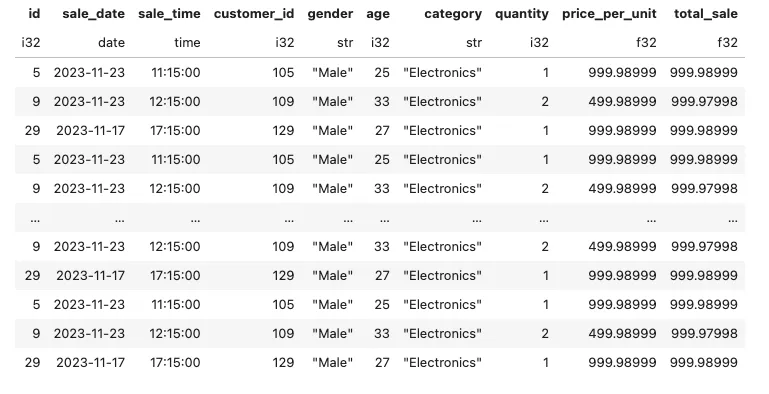
编写一个SQL查询语句,查找每个类别中按性别统计的交易总数
conn.sql('''
    select
        category
        , gender
        , count(*) as total_trans
    FROM retail_sales
    group by category
            , gender
    order by 2
''').pl()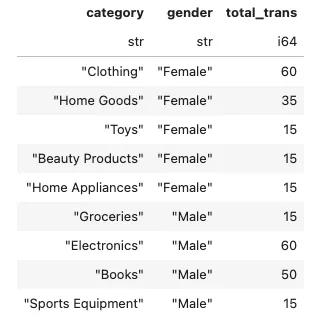
编写一个SQL查询语句,计算每个月的平均销售额。
conn.sql('''
    select
        year
        , month
        , avg_sale
    from
        (
        select
            extract(year from sale_date) as year
            , EXTRACT(month from sale_date) as month
            , round(avg(total_sale),2) as avg_sale
            , rank() over(partition by extract(year from sale_date)
            order by avg(total_sale) desc) as rank
        from retail_sales
        group by 1, 2
        ) as t1
''').pl()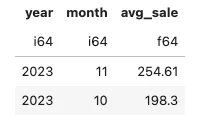
编写一个SQL查询语句,查找总销售额最高的前5名客户。
conn.sql('''
    select customer_id
            , round(sum(total_sale),2) as total_sales
    from retail_sales
    group by 1
    order by 2 desc
    limit 5
''').pl()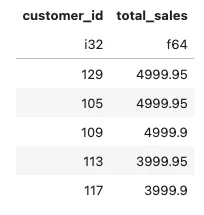
编写一个SQL查询语句,查找每个类别中购买过商品的不同客户数量。
customers = conn.sql('''
    select category
            , count(distinct customer_id) as count_unique
    from retail_sales
    group by category
    order by 2 desc
''').pl()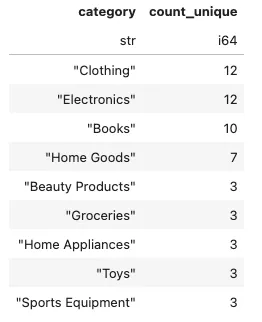
fig = px.bar(customers,
             x="count_unique",
             y="category",
             orientation='h',
             hover_data=['category','count_unique',],
            )
fig.update_traces(marker_color='#954535', marker_line_color='black',
                  marker_line_width=1.5, opacity=0.9)
fig.update_layout(width=850,
                  height=500,
                  title_text='<i>Unique Customers Purchases by Category during 2023</i>',
                  title_x=0.2,
                  template="ggplot2",
                  yaxis={'categoryorder':'total ascending'}
                 )
fig.show()
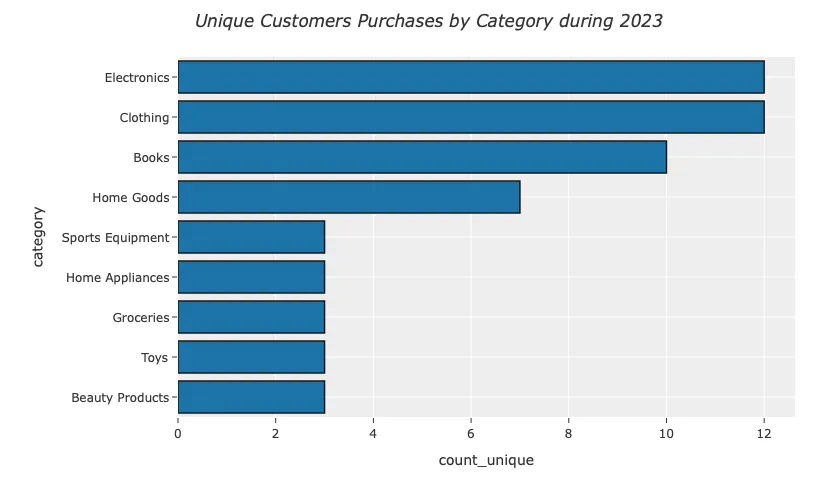
编写一个SQL查询语句,以创建每个时段及订单数量的统计(例如:早上<12点,下午12点至17点之间,晚上>17点)。
conn.sql('''
    with hourly_sale as
        (
        select *
            , case
                when extract(hour from sale_time) <12 then 'Morning'
                when extract(hour from sale_time) between 12 and 17 then 'Afternoon'
            else 'Evening'
            end as shift
        from retail_sales
        )
    select
        shift
        , count(*) as total_orders
    from hourly_sale
    group by shift
''').pl()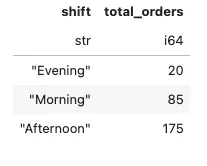
关闭连接
# Close connection
conn.close()
结论
本项目展示了将Python与DuckDB结合使用进行高效且富有洞察力的SQL分析的强大功能。通过掌握这些工具,数据分析师可以简化工作流程,发现有价值的见解,并做出推动业务成功的基于数据的决策。
文章来源:https://medium.com/h7w/supercharge-your-sql-analysis-with-python-and-duckdb-d28acaa0f697

欢迎关注ATYUN官方公众号
商务合作及内容投稿请联系邮箱:bd@atyun.com
热门企业
热门职位
写评论取消
回复取消


