通过小波变换实现高效时频分析
介绍
小波变换是分析时变信号最强大的工具之一,它同时提供了时间和频率分辨率。与仅揭示信号频率内容的傅里叶变换不同,小波变换提供了一种更为丰富的表示方法,能够捕捉到信号中何时存在哪些频率。
什么是小波变换?
小波变换是一种数学技术,用于将一个信号分解成简单、振荡的波状函数(称为小波)的缩放和平移版本。小波的关键优势在于它们允许我们在不同的尺度(频率)上局部分析信号。
信号x(t)的连续小波变换(CWT)定义为:

其中:
- ψ(t)是母小波,一个根据信号特性选择的函数。
- a是缩放因子(膨胀),控制频率。
- b是平移因子,控制时间偏移。
- ψ*是小波函数的复共轭。
我们还可以进一步简化
- a:缩放因子a会拉伸或压缩小波。a的较大值对应低频分量(粗略细节),而较小值对应高频分量(精细细节)。
- b:平移因子b会在时间上移动小波,使我们能够定位信号中特定频率分量出现的位置。
- 小波函数:小波在傅里叶分析中类似于正弦波,但与正弦波不同的是,小波在时间上具有局部性。
小波变换的结果是信号的时频表示,显示了不同频率分量如何随时间演变。
小波变换与傅里叶变换的比较
为了理解小波为何如此有用,让我们将它们与傅里叶变换进行比较。傅里叶变换将信号分解为构成频率,但它不提供关于这些频率何时出现的信息。对于频率内容不随时间变化的平稳信号来说,这没问题,但大多数真实世界信号是非平稳的。
然而,小波变换允许我们同时分析信号的时间和频率。
例如:
- 在脑电图(EEG)或心电图(ECG)信号中,我们可能想要检测某些频段(如α波或心脏心律失常)何时显著。
- 在地震数据中,我们可能想要追踪随时间变化的不同类型地面运动相关的频率变化。
示例:快速比较
让我们使用Python快速比较一下傅里叶变换和小波变换的结果。
import numpy as np
import matplotlib.pyplot as plt
from scipy.fft import fft
from scipy.signal import morlet, cwt
# here we simulate a simple signal: sum of two sine waves
t = np.linspace(0, 1, 1000, endpoint=False)
signal = np.sin(2 * np.pi * 5 * t) + np.sin(2 * np.pi * 50 * t)
# calcualte the fourier transform
fft_values = fft(signal)
# plot the original signal
plt.figure(figsize=(20,11))
plt.subplot(2, 1, 1)
plt.plot(t, signal)
plt.title('Original Signal (Time Domain)')
plt.xlabel('Time [s]')
plt.ylabel('Amplitude')
# plot the fourier transform of the simulated sequence
frequencies = np.fft.fftfreq(len(t), d=t[1] - t[0])
plt.subplot(2, 1, 2)
plt.plot(frequencies, np.abs(fft_values))
plt.title('Fourier Transform (Frequency Domain)')
plt.xlabel('Frequency [Hz]')
plt.ylabel('Amplitude')
plt.tight_layout()
plt.show()

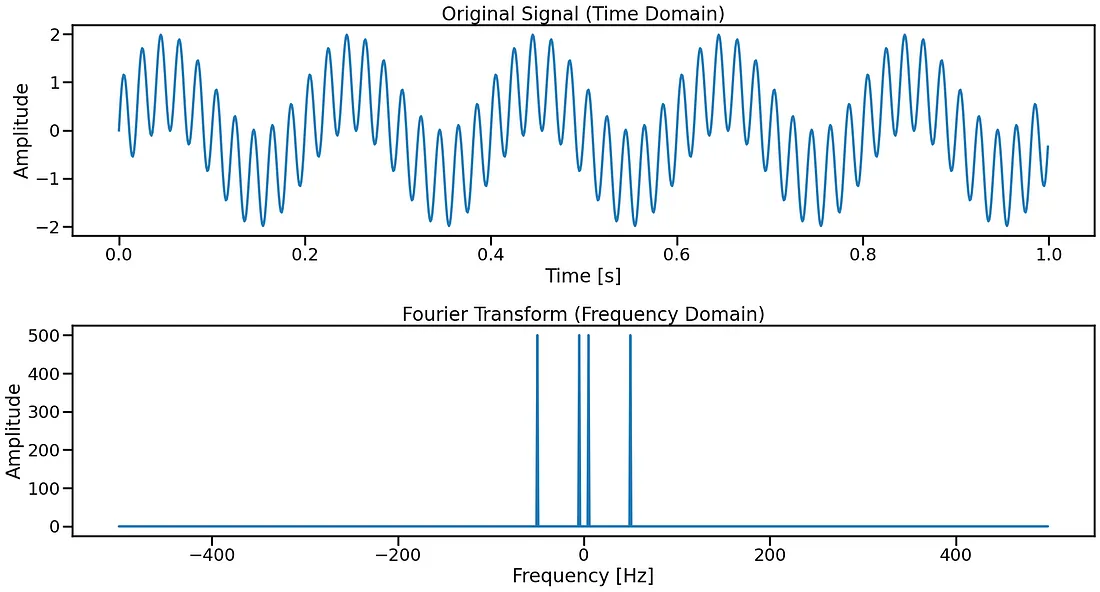
在时间域中,我们看到了原始信号——它是5 Hz和50 Hz两个正弦波的组合。
在频域中,傅里叶变换正确地识别出了这两个频率。然而,它并没有告诉我们这些频率在信号中何时出现。这就是小波变换的用武之地。
小波变换
选择小波
小波的选择取决于你正在分析的信号的特性。常见的小波包括:
- Morlet小波:常用于分析振荡信号。
- Mexican Hat小波:适合分析像尖峰这样的瞬态事件。
- Haar小波:最简单的小波,用于边缘检测很有用。
在我们的示例中,我们将使用Morlet小波,它特别擅长捕捉振荡。
示例:合成信号的小波变换
让我们对包含高频和低频分量的信号应用连续小波变换(CWT)。
from scipy.signal import cwt, morlet
# simulate another signal: sum of sine waves with varying frequencies
signal = np.sin(2 * np.pi * 5 * t) + np.sin(2 * np.pi * 50 * t) + np.sin(2 * np.pi * 20 * t)
# set the wavelet scales
scales = np.arange(1, 100)
# performe continuous wavelet transform using the Morlet wavelet
coefficients = cwt(signal, morlet, scales)
# display the original signal and the wavelet transform result
plt.figure(figsize=(20, 11))
plt.subplot(2, 1, 1)
plt.plot(t, signal)
plt.title('Original Signal (Time Domain)')
plt.xlabel('Time [s]')
plt.ylabel('Amplitude')
plt.subplot(2, 1, 2)
plt.imshow(np.abs(coefficients), extent=[0, 1, 1, 100], cmap='PRGn', aspect='auto',
           vmax=abs(coefficients).max(), vmin=-abs(coefficients).max())
plt.title('Wavelet Transform (Time-Frequency Domain)')
plt.xlabel('Time [s]')
plt.ylabel('Scale')
plt.tight_layout()
plt.show()

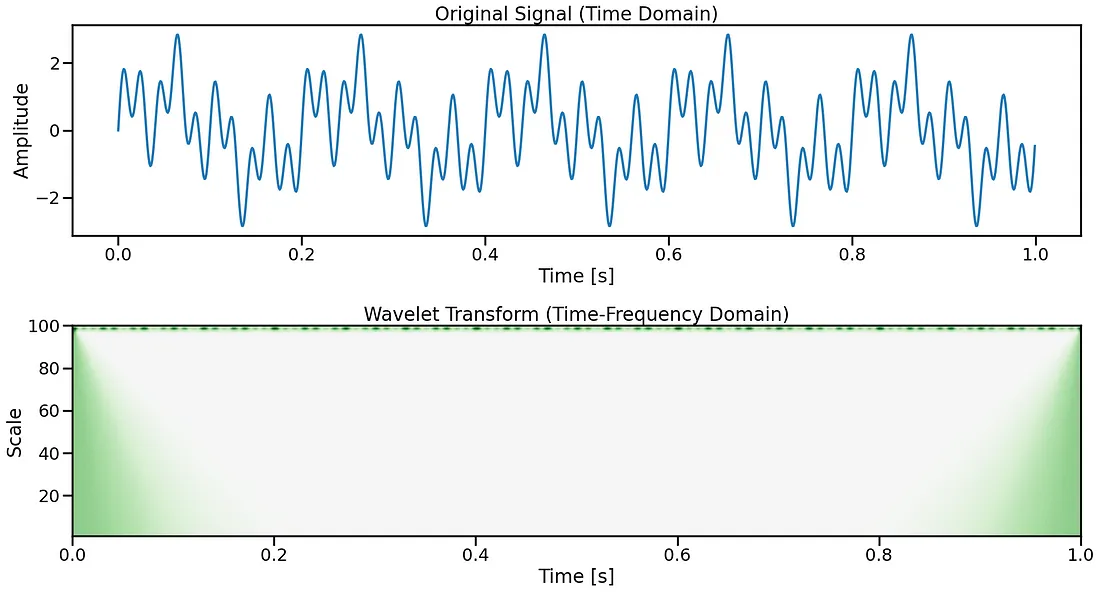
第一幅图显示了原始信号,其中包含5 Hz、20 Hz和50 Hz的振荡。
第二幅图展示了小波变换,它揭示了信号频率内容如何随时间变化。纵轴代表尺度(与频率相关),颜色强度表示在每个尺度和时间点上信号的强度。
由此,我们可以清楚地看到信号中每个频率分量的存在时间,这是傅里叶变换无法展示的。
现实世界示例:地震数据分析
现在,让我们使用小波变换来分析现实世界的数据。地震数据记录了随时间变化的地面运动,是非平稳信号的一个绝佳示例,其中小波非常有用。
我们将使用一个地震数据集示例来识别瞬态地震事件并分析其频率内容。
第一步:加载数据
我们将使用obspy库,它可以访问真实世界的地震数据。
pip install obspy
from obspy.clients.fdsn import Client
from obspy import UTCDateTime
import matplotlib.pyplot as plt
# create a client for IRIS data
client = Client("IRIS")
# specify the event time and parameters
starttime = UTCDateTime("2020-01-01T00:00:00")
endtime = starttime + 60 * 60  # 1 hour of data
# retrieve the waveform data for a specific station
# Example: Station ANMO, Network IU, Channel BHZ (Broadband High Gain Vertical)
waveform = client.get_waveforms(network="IU", station="ANMO", location="00", channel="BHZ",
                                starttime=starttime, endtime=endtime)
# extract the trace
tr = waveform[0]
# plot the waveform (time domain)
tr.plot(type="relative")

参数解释:
- network="IU":指定网络代码(国际地震中心网络代码)。
- station="ANMO":指定位于新墨西哥州阿尔伯克基的地震台站代码(ANMO)。
- channel="BHZ":选择垂直宽带通道。
- starttime=t:波形检索的开始时间。
- endtime=t + 60 * 60:波形检索在一小时后结束。
第二步:应用小波变换
现在我们已经使用IRIS客户端检索了真实世界的地震数据,接下来就可以按照之前描述的方法应用小波变换了。
from scipy.signal import cwt, morlet
import numpy as np
import matplotlib.pyplot as plt
# extract the seismic data from the trace
seismic_data = tr.data
times = np.linspace(0, tr.stats.npts / tr.stats.sampling_rate, tr.stats.npts)
# increase the range and resolution of scales
scales = np.arange(1, 256)
# perform wavelet transform using the Morlet wavelet
coefficients = cwt(seismic_data, morlet, scales)
# plot the original signal and the wavelet transform result
plt.figure(figsize=(12, 6))
# plot the seismic signal (time domain)
plt.subplot(2, 1, 1)
plt.plot(times, seismic_data)
plt.title('Seismic Signal (Time Domain)')
plt.xlabel('Time [s]')
plt.ylabel('Amplitude')
# plot the wavelet transform (time-frequency domain) with adjusted color scaling
plt.subplot(2, 1, 2)
plt.imshow(np.abs(coefficients), extent=[times[0], times[-1], scales[-1], scales[0]],
           cmap='inferno', aspect='auto', vmax=np.percentile(np.abs(coefficients), 99),
           vmin=np.percentile(np.abs(coefficients), 1))
plt.title('Wavelet Transform (Time-Frequency Domain)')
plt.xlabel('Time [s]')
plt.ylabel('Scale')
plt.colorbar(label='Magnitude')
plt.tight_layout()
plt.show()
上面的图表示时间域中的地震信号,展示了地面运动如何随时间变化。
下面的图展示了小波变换生成的时间-频率表示。颜色强度显示了不同时间点上频率分量的强度。
结论
小波变换是分析具有非平稳或时变频率成分信号的有力工具。如果你处理的数据中频率成分随时间变化,如地震信号、脑电图数据甚至金融数据,小波变换可以帮助你发现其他方法(如傅里叶变换)可能遗漏的时频模式。


