深入文本分析:文本聚类与主题建模的实践指南(2)
在前一部分中,我们探索了一种文本聚类的实践方法,该方法使用由嵌入、降维和聚类组成的管道。我们演示了如何处理来自 arXiv NLP 数据集的 44,949 篇摘要,最终得到 159 个有意义的聚类。但是,单独的聚类只能显示相关文档的组 — 它不会标记这些组。在本文中,我们将解决主题建模,即通过提取代表性关键字为聚类分配可解释标签的过程。
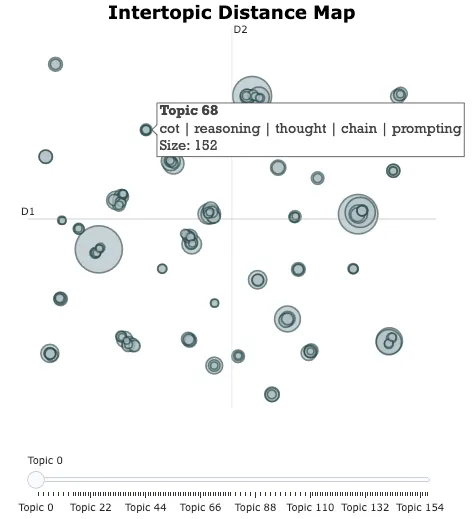
我们将深入研究传统和现代方法,使用BERTopic框架在 Python 中实现它们,并可视化结果以发现见解。让我们开始吧。
什么是主题建模?
主题建模是通过分配描述性关键字来表示内容,从而总结一组文档的技术。例如:
- 与宠物相关的主题的聚类可能会产生诸如dog、、、和之cat类的关键词。petshelter
- 与烹饪相关的集群可能包括pasta、、、和等关键词。recipepizzacooking
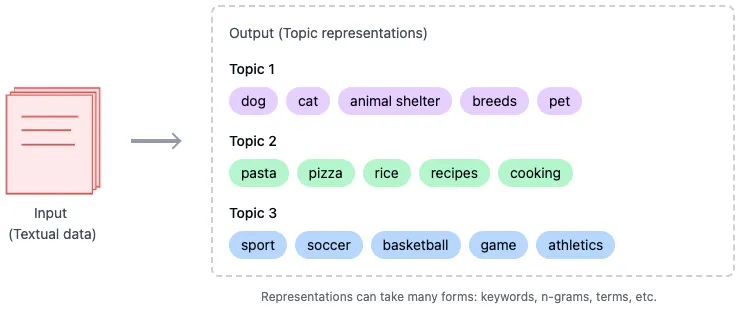
与为每个集群分配单个标签的传统方法不同,像BERTopic这样的现代框架会识别出最能描述每个集群的关键字集合。
BERTopic
BERTopic是一个主题建模的模块化框架,旨在与嵌入模型、降维和聚类算法无缝集成。BERTopic 流程的第一部分如下:
- 嵌入文档:将文档转换为高维向量。我们已成功使用模型将每个文档转换为 1024 维 — 该模型stella-en-400M-v5选自MTEB,其中顶级聚类模型按 Hugging Face 上的 V 度量指标排列。
- 降维:使用UMAP将嵌入从高维降低到低维,从 1024 降低到 10 。
- 对简化的嵌入进行聚类:我们已成功使用HDBSCAN对聚类进行分组,这使我们能够对异常值进行聚类。

第二部分,为每个簇提取关键词,并根据提取的术语分配有意义的标签。

该管道的一个关键优势是聚类过程和主题表示之间的相对独立性。例如,不依赖于用于聚类文档的特定模型。因此,我们可以使用 PCA 代替 UMAP,使用 DBSCAN 代替 HDBSCAN,并使用其他表示模型代替和 的c-TF-IDF组合进行主题表示。这种设计确保了所有管道组件的高度模块化。CountVectorizerc-TF-IDF
BERTopic 的管道实现
下面是使用BERTopic框架从聚类到主题建模的完整流程。
步骤 1:安装依赖项
pip install sentence-transformers xformers bertopic datasets openai datamapplot plotly
步骤2:加载数据集
# Load data from huggingface
from datasets import load_dataset
dataset = load_dataset("maartengr/arxiv_nlp")["train"]
# Extract metadata
abstracts = dataset["Abstracts"]
titles = dataset["Titles"]
步骤 3:生成嵌入
使用sentence-transformers库中的stella_en_400M_v5模型。
from sentence_transformers import SentenceTransformer
# Create an embedding for each abstract
embedding_model = SentenceTransformer('dunzhang/stella_en_400M_v5', trust_remote_code=True)
embeddings = embedding_model.encode(abstracts, show_progress_bar=True)
步骤4:降维
使用UMAP将高维嵌入减少到 10D 。
from umap import UMAP
# We reduce the input embeddings from 1024 dimenions to 10 dimenions
umap_model = UMAP(
    n_components=10, min_dist=0.0, metric='cosine', random_state=42
)
reduced_embeddings = umap_model.fit_transform(embeddings)
步骤 5:聚类
使用HDBSCAN形成减少嵌入的聚类。
from hdbscan import HDBSCAN
# We fit the model and extract the clusters
hdbscan_model = HDBSCAN(
    min_cluster_size=50, metric='euclidean', cluster_selection_method='eom'
).fit(reduced_embeddings)
clusters = hdbscan_model.labels_
步骤 6:使用 BERTopic 进行主题建模
在 BERTopic 中结合嵌入、降维和聚类。
from bertopic import BERTopic
# Train our model with our previously defined models
topic_model = BERTopic(
    embedding_model=embedding_model,
    umap_model=umap_model,
    hdbscan_model=hdbscan_model,
    verbose=True
).fit(abstracts, embeddings)
检查聚类主题
快速检查主题
让我们深入探索BERTopic生成的主题:
# Fetch the topics
topic_model.get_topic_info()
输出:

运行topic_model.get_topic_info()的输出显示了BERTopic模型生成的主题的详细元数据。以下是每列及其提供信息的解释:
列解释:
主题:
- 这列列出了分配给每个聚类的唯一主题ID。
- -1:表示离群值或无法分配给任何特定聚类的文档。
- 其他值(0, 1, 2, ...)对应于生成的主题。
计数:
- 表示分配给每个主题的文档数量。
- 较大的计数表明是主导或更受欢迎的主题,而较小的计数可能表明是小众或较少讨论的主题。
- 例如,topic-1有13,040个文档,表示有一大组离群值,而topic0有2,482个文档,是识别出的主要聚类之一。
名称:
- 为主题提供唯一标识符或标签,通常结构为<topic_id>_<keywords>。
- 名称中包含的关键词快速概述了与该主题相关的主要术语。
- 示例:主题1_medical_clinical_biomedical_patient反映了其关注医疗和临床相关内容。
表示:
- 这列列出了每个主题的提取关键词。这些关键词是使用c-TF-IDF方法或其他主题表示方法得出的,并总结了主题的核心内容。
- 例如:主题0:关键词如speech, asr, recognition, end, acoustic表明其关注语音识别系统。主题155:关键词如emoji, emojis, emoticons, sentiment表明该主题与表情符号使用和情感分析有关。
代表性文档:
- 显示每个主题的代表性文档(或文档摘要)样本。
- 这些文档作为属于该聚类的内容类型的示例,帮助用户理解主题的上下文和意义。
- 示例:对于主题1_medical_clinical_biomedical_patient,代表性文档可能讨论医疗概念的分布式表示。
结果中的见解:
主导主题:
主题0是最大的聚类,有2,482个文档,关注语音识别(speech, asr, recognition, acoustic)。这可能代表了数据集中一个重要的研究领域。
小众主题:
像157_deception_reviews_deceptive_fake(51个文档)或153_translation_english_en_submission(53个文档)这样的主题表明较小的聚类处理特定主题,如欺骗性评论和翻译系统。
离群值:
主题-1被标记为离群值聚类,具有通用关键词(of, the, and, to)并包含13,040个文档。这个主题可能包括:没有明确主题相似性的文档。噪声或无关数据。
关键词分布:
关键词提供了主题主题的简洁总结。例如:
对于主题3,summarization, summaries, summary, abstractive表明其关注文本摘要技术。
对于主题1,medical, clinical, biomedical明确指出与医疗保健相关研究。
理解代表性文档:
Representative_Docs列提供了直接了解每个聚类背后真实世界内容的方式。这些文档对于验证生成主题的准确性和一致性至关重要。
单独检查主题
我们还可以使用get_topic(<topic_number>)单独检查主题。示例如下:、
topic_model.get_topic(15)
输出:
[('morphological', 0.03180901561754959),
 ('subword', 0.021767213735360412),
 ('character', 0.01806202274504348),
 ('tokenization', 0.013643008991703304),
 ('languages', 0.011831199917118796),
 ('bpe', 0.011474163603948092),
 ('word', 0.011269847039854718),
 ('segmentation', 0.011219194104966166),
 ('morphology', 0.011096301412965344),
 ('morphologically', 0.01090045014679196)]
主题15包含关键词“子词”、“分词”和“bpe”(字节对编码)。这些关键词表明该主题主要集中在分词技术上。
我们可以使用find_topics(<topic_name_we_are_interested>)来搜索与给定搜索词相关的特定主题。让我们来试一试:
topic_model.find_topics("Large Language Models")输出:
([11, -1, 104, 50, 52],
 [0.7391623, 0.7299156, 0.72964495, 0.71527004, 0.69776237])
分数越高(越接近1)意味着该主题与搜索词的相关性越高。在这个结果集中,主题11的相关性得分最高(0.73),而主题52的得分最低(0.69)。
让我们进一步检查以确认该主题是否关于大型语言模型。
topic_model.get_topic(11)
输出:
[('evaluation', 0.017788030494504652),
 ('metrics', 0.013616483806350986),
 ('llms', 0.012587065788634971),
 ('human', 0.010760840609925439),
 ('chatgpt', 0.01052913018463233),
 ('nlg', 0.009619504603365265),
 ('llm', 0.007265654969843764),
 ('language', 0.007094052507181346),
 ('generation', 0.006545947578436024),
 ('of', 0.0063761418431831154)]
我们可以看到关键词——“llms”(大型语言模型)、“generation”(生成)、“language”(语言)、“chatgpt”。这证实了该主题确实是关于大型语言模型的。
我们可以进一步通过topic_model.topics_[titles.index(<摘要的标题>)]来确认。
topic_model.topics_[titles.index("A Survey on Evaluation of Large Language Models")]输出是11。
视觉检查
在3D空间中可视化主题
BERTopic提供了内置的topic_model.visualize_documents来进行可视化。不过,它有一个限制——只能查看2D视图。因此,我们将使用原始代码和plotly库来查看3D视图。
# Import necessary libraries
import pandas as pd
import plotly.express as px
from umap import UMAP
# Step 1: Dimensionality Reduction
# Reduce high-dimensional embeddings (1024D) to 3D space for visualization
# UMAP is chosen for its ability to preserve both local and global structure
reduced_embeddings_3d = UMAP(
    n_components=3,    # Target 3 dimensions for 3D visualization
    min_dist=0.0,      # Minimum distance between points, 0.0 for tighter clusters
    metric='cosine',   # Cosine similarity is well-suited for text embeddings
    random_state=42    # Set seed for reproducibility
).fit_transform(embeddings)
# Step 2: Create DataFrame with 3D Coordinates
# Transform UMAP output into a pandas DataFrame for easier manipulation
df_3d = pd.DataFrame(
    reduced_embeddings_3d,
    columns=["x", "y", "z"]  # Name dimensions for clarity
)
df_3d["title"] = titles                         # Add document titles
df_3d["cluster"] = [str(c) for c in clusters]   # Add cluster labels
# Step 3: Prepare DataFrames for Merging
# Convert data types to ensure consistent joining
topic_df = topic_model.get_topic_info()         # Get topic modeling results
topic_df['Topic'] = topic_df['Topic'].astype(int)
df_3d['cluster'] = df_3d['cluster'].astype(int)
# Step 4: Merge Topic Information with Coordinates
# Combine topic information with 3D coordinates using inner join
merged_df = topic_df.merge(
    df_3d,
    left_on='Topic',
    right_on='cluster',
    how='inner'
)
# Step 5: Select Relevant Columns
# Keep only necessary columns for visualization
columns_to_keep = ['Name', 'x', 'y', 'z', 'title']
final_df = merged_df[columns_to_keep]
# Step 6: Create Interactive 3D Visualization
# Use Plotly Express for an interactive 3D scatter plot
fig = px.scatter_3d(
    final_df,
    x='x',
    y='y',
    z='z',
    color='Name',      # Color points by topic name
    title='Interactive 3D UMAP Visualization of NLP Research Topics',
    opacity=0.7,       # Set partial transparency for better visibility
    color_continuous_scale='viridis',  # Use viridis color palette
    size_max=0.5,      # Control point size
    hover_data=['title']  # Show document title on hover
)
# Step 7: Customize Plot Layout
# Adjust plot dimensions and enable legend
fig.update_layout(
    width=1200,
    height=700,
    showlegend=True
)
# Display the interactive plot
fig.show()
输出:
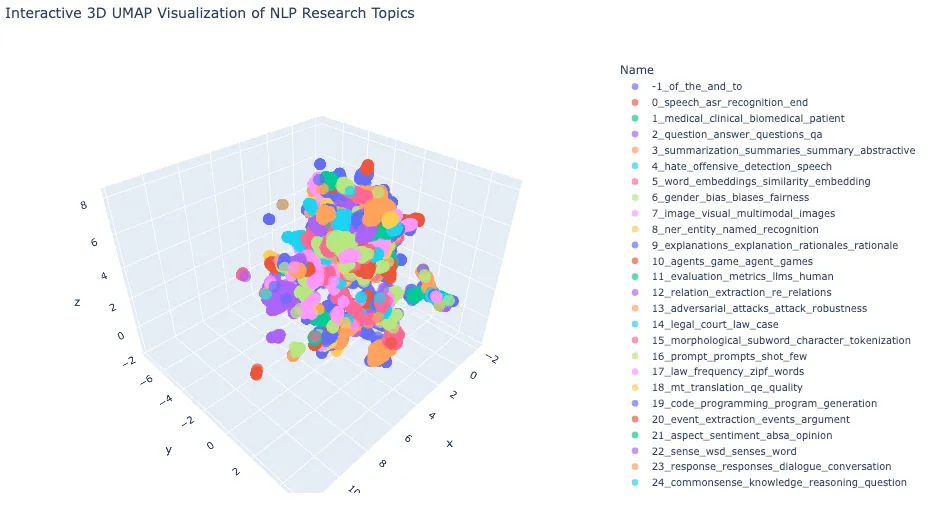
让我们将鼠标悬停在每个集群上,以根据我们感兴趣的主题探索摘要的标题。
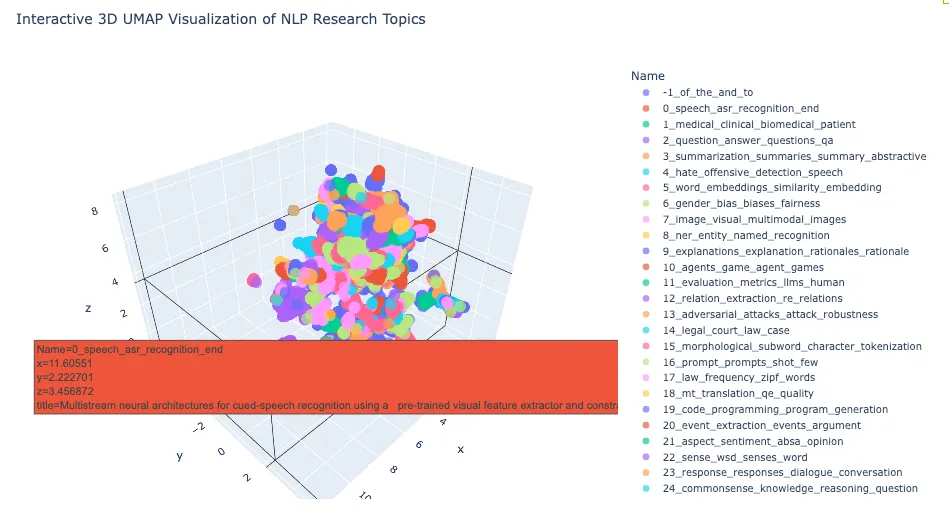
我们无需手动确定,就可以在3D空间中直观地看到BERTopic为每个集群分配的主题名称。
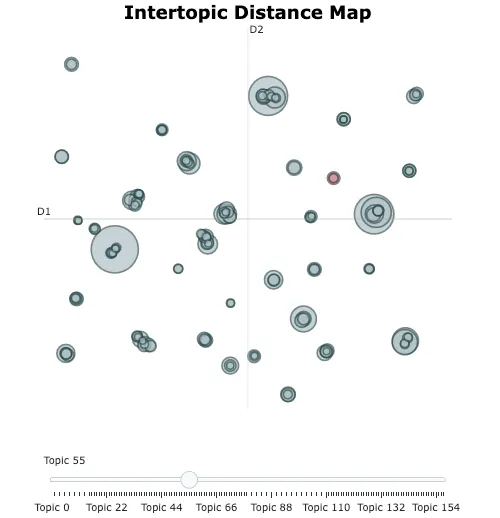
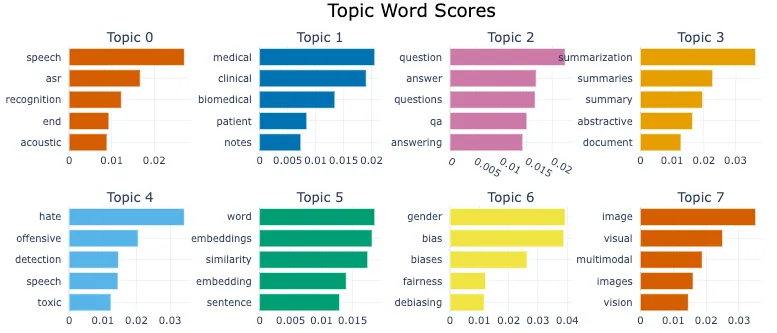
BERTopic还提供了其他多种可视化方式。让我们来探索一下。
在2D空间中可视化主题。
topic_model.visualize_topics()
输出:
topic_model.visualize_barchart()
输出:
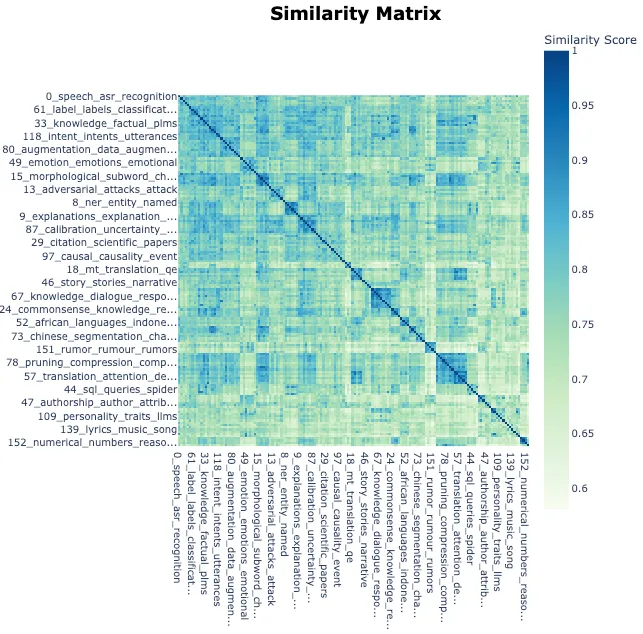
# Visualize relationships between topics
topic_model.visualize_heatmap(n_clusters=30)
输出:
结论
在本文中,我们:
- 使用BERTopic进行主题建模,将arXiv上的NLP论文摘要集群转化为可操作的见解。
- 为集群分配描述性关键词作为标题:为每个集群分配了描述性关键词,从而能够有效地理解庞大的数据集。
- 无需手动检查:通过自动化主题分配过程,消除了手动检查的需求。


