使用K均值聚类与Silhouette分数确定最佳聚类数
K-Means clustering是最受欢迎的无监督学习技术之一,用于将数据点分组为不同的簇。然而,确定最佳簇数(“k”)对于实现有效的聚类至关重要。有多种方法可用于确定最佳簇数,其中最流行的方法包括我之前解释过的Elbow法以及Silhouette Score。在多种方法中,Silhouette Score脱颖而出,成为评估聚类质量和确定最佳聚类数的可靠指标。
在本文中,我们将深入探讨轮廓系数是什么、如何计算以及如何利用它来改进K-均值聚类。我们还将提供Python代码示例,以展示其实际应用。
什么是轮廓系数?
轮廓系数(Silhouette Score)通过评估数据点在其所属簇内与其他簇中的拟合程度来衡量聚类的质量。它是针对每个点计算的,然后对数据集中的所有数据点取平均值。
该分数有助于回答两个问题:
- 簇内的数据点有多相似(簇内凝聚力)?
- 数据点与其他簇的数据点有多大差异(簇间分离度)?
如何计算轮廓系数?
为了计算一个数据点的轮廓(Silhouette)系数,需要考虑两个距离:
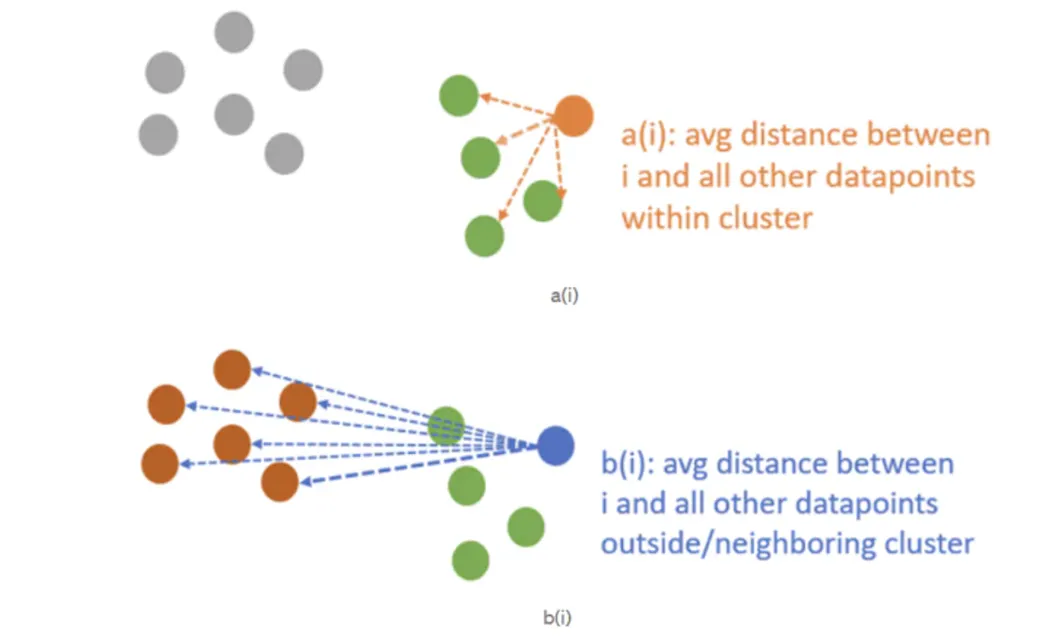
公式:

a(i)(簇内距离):数据点(i)与其所在簇内所有其他数据点的平均距离。
b(i)(最近簇距离):数据点(i)到其不属于的最近簇中所有点的平均距离。
S(i):数据点(i)的轮廓系数。
轮廓系数是单个点的分数。
轮廓分数是所有单个轮廓系数的平均值。
计算结果表明,每个点的轮廓系数衡量了该点与其他簇相比,与其所在簇的相似程度。通过计算不同“k”值下的平均轮廓分数,可以帮助确定最佳簇数(“k”)。
轮廓分数的范围在-1到1之间:
- 如果分数S(i)为1,这意味着数据点聚类效果很好,边界清晰,靠近其所在簇且远离其他簇。
- 如果分数S(i)接近1,数据点理想地靠近其所在簇,且边界清晰。
- 分数高于0.5表示轮廓分数较高,但我们需要选择最接近1的那个。
- 分数为1或接近1意味着簇密集且与其他簇分离良好。
- 如果分数S(i)为0或接近0,数据点位于簇之间的边界上,表明存在重叠或靠近簇边界。接近0表示样本非常接近相邻簇的决策边界。
- 如果分数S(i)接近-1或为负数,数据点可能被分配到了一个不合适的簇。
- 如果分数S(i)为-1,数据点可能被分配到了一个错误的簇,并且很可能被误分类。
轮廓分数可以使用轮廓图进行可视化,该图显示所有数据点的分数,并突出显示分数较低的簇。
Python中的轮廓分析实现
让我们使用scikit-learn库在Python中实现轮廓分数。同时,我们将使用之前在肘部方法中使用的相同代码部分。
#required libraries
'''
  numpy library was used for handling numerical operations and data arrays
  pyplot module of matplotlib library was used for visualizations and plots
  cm module of matplotlib library was used to provide colormaps for silhouette
 plots
  Kmeans algorithm of cluster module of sklearn was used to create k-means
clustering
  silhouette_samples and silhouette_score metrics of metrics module of sklearn
  libray was used for evaluating the quality of clustering and finding the optimal
number of clusters.
  make_blobs method of datasets module of sklearn was used to generate synthetic
cluster-like dataset, it useful for testing clustering algorithms and methods.
'''
import numpy as np
import matplotlib.pyplot as plt
import matplotlib.cm as cm
from sklearn.cluster import KMeans
from sklearn.metrics import silhouette_score, silhouette_samples
from sklearn.datasets import make_blobs
#Generating synthetic data
'''
np.random.seed(42) sets the random seed for reproducibility.
Using 42 is a just a common practice.
X,_=make_blobs(...)
  generates a synthetic dataset X
    with 300 samples
    centers=4 indicates that the generated data is formed around 4 cluster centers.
    cluster_std=0.7 specifies the standart deviation of the clusters, controlling
  how tight or spread out the clusters are.
    random_state=42 ensures reproducibility of the randomly generated data.
The variable X will be an arrayof shape (300, 2) since make_blobs by default genrates
2D points. The underscore(_) represents the clusters labels produced by make_blobs which we
do not need right now.
'''
np.random.seed(42)
X, _ = make_blobs(n_samples=300, centers=4, cluster_std=0.7, random_state=42)
#Range of clusters to evaluate
#Silhouette score requires at least two cluster
#Defines a range of possible cluster numbers (k) to test.
cluster_range = range(2, 11)
#initializing list to store silhouette scores
silhouette_scores=[]
for k in cluster_range:
  '''
  Loop over each k from 2 to 11
  kmeans=KMeans(...) created a K-Means model with k clusters.
    random_state=42 ensures the results and reproducible
    n_init=10 means the algorithm will be run 10 times with different initial
  centroids and choose the best result.
    labels=kmenas.fit_predict(X) fits the Kmeans model on X and returns the labels
  (cluster assignments) for each point.
'''
  #Kmeans clustering using default (Euclidean) distance
  kmeans=KMeans(n_clusters=k, ramdom_state=42, n_init=10)
  labels=kmeans.fit_predict(X)
  '''
    silhouette_score computes the average silhouette score for all data points.
    it will range from -1 to 1
  '''
  score=silhouette_score(X,labels)
  silhouette_scores.append(score)

  #Silhouette samples for plotting
  '''
    sample_silhouette_values calculates the silhouette scores for each data points
    it was used to generate the silhouette plot showing scores for individual points
   in each cluster.
  '''
  sample_silhouette_values= silhouette_samples(X,labels)
  #Create a subplot with silhouette and cluster visualization
  '''
    creates a figure with two subplots:
       Left will be silhouette plot to visualize silhouette scores for all points
       Right will be a cluster visualization plots clustered data
  '''
  fig, (ax1,ax2)=plt.subplots(1,2)
  fig.set_size_inches(18,7)
  #Silhouette plot
  #Setting the x-axis and y-axis limits for the silhouette plot
  ax1.set_xlim([-0.1,1])
  ax1.set_ylim([0, len(X) + (k+1)*10])
  y_lower=10
  for i in range(k):
      '''
        for each cluster i:
            extract silhouette scores for points in the cluster
            sort the scores and plot them in a horizontal bar
            use color to distinguish clusters
            y_upper and y_lower determine where the cluster bar starts and ends.
            adds a cluster label using text(...)
      '''
     #Aggregrate and sort silhouette scores for each cluster
     ith_cluster_silhouette_values=samples_silhouette_values[labels=i]
     ith_cluster_silhouette_values.sort()

     size_cluster_i= ith_cluster_silhouette_values.shape[0]
     y_upper=y_lower + size_cluster_i
     color= cm.nipy_spectral(float(i)/k)
     ax1.fill_between(np.arrange(y_lower,y_upper),0,ith_cluster_silhouette_values,
                      facecolor=color, edgecolor=color, alpha=0.7)
     ax1.text(-0.5, y_lower+0.5*size_cluster_i,str(i))
     y_lower=y_upper+10

  ax1.set_title('The silhouette plot for various clusters.')
  ax1.set_xlabel('Silhouette Coefficient Values')
  ax1.set_ylabel('Cluster label')
  #adds a red dashed vertical line to indicate the average silhouette score
  ax1.axvline(x=score, color='red', linestyle='--')
  ax1.set_yticks([])
  #cluster visualization
  '''
    plots the clustered data in 2 dimentional space
    colors assigns a color to each cluster
  '''
  colors=cm.nipy_spectral(labels.astype(float)/k)
  ax2.scatter(X[:,0], X[:,1], marker='.',s=30,lw=0,alpha=0.7, c=colors,edgecolor='k')
  '''
  adds cluster center (wwhite circle) and labels
  centers=kmeans.cluster_centers_ extracts the final cluster centroids found by KMeans
  '''
  centers=kmeans.cluster_centers_
  ax2.scatter(centers[:,0], centers[:,1],marker='o', c='white', alpha=1, s=200,edgecolor='k')
  for i, c in enumerate(centers):
    ax2.scatter(c[0],c[1], marker=f"${i}$", alpha=1, s=50, edgecolor='k')
  ax2.set_title('The visualization of the clustered data.')
  ax2.setx_label('Feature Space for the 1st Feature')
  ax2.sety_label('Feature Space for the 2nd Feature')
  #Add a title to the combined plot
  plt.subtitle(f'Silhouette analysis for Kmeans clustering on data with n_clsuters={k}',
               fontsize=14,fontweight='bold')

#Final Plot Silhouette Method results
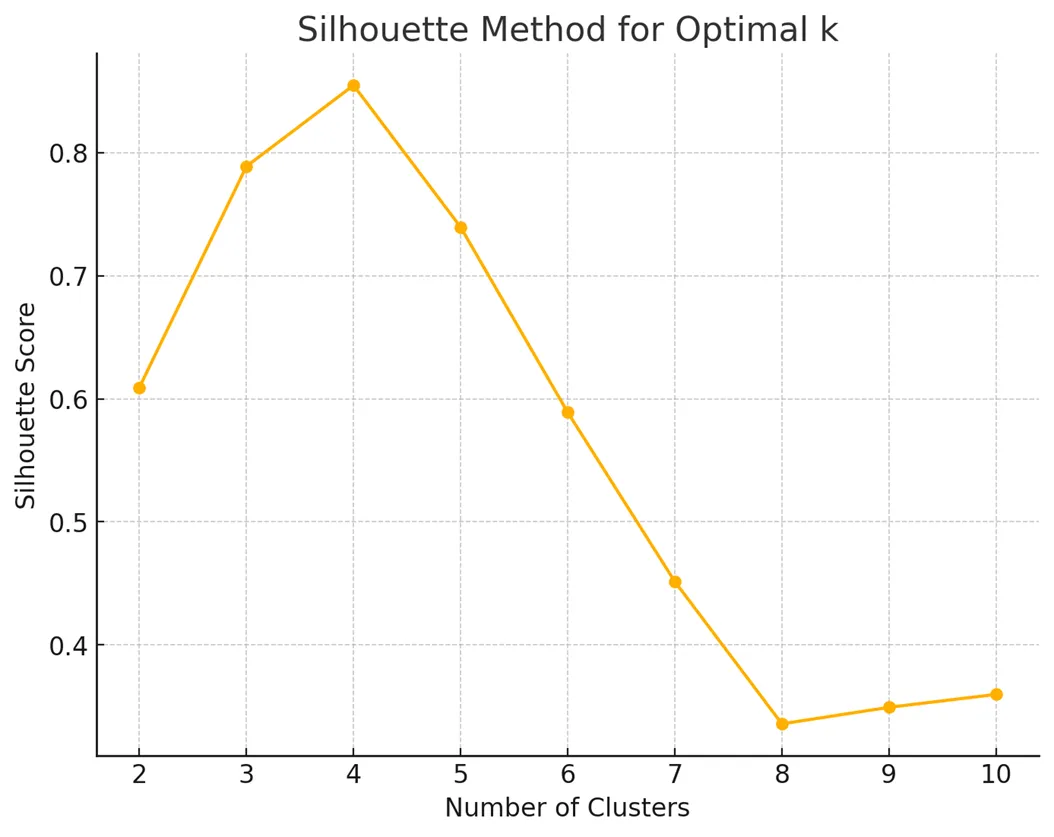
'''
plots the average silhouette scores for all k values
the highest point on this plot indicates the optimal number of clusters
'''
plt.figure(figsize=(8,6))
plt.plot(cluster_range, silhouette_scores, marker='o', linestyle='-')
plt.title('Silhouette Method for Optimal Number of Clusters (k)')
plt.xlabel('Number of Clusters')
plt.ylabel('Silhouette Score')
plt.grid(True)
plt.show()
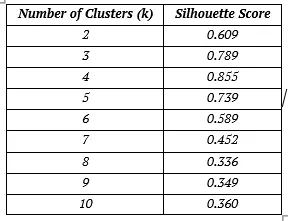
silhouette_scores
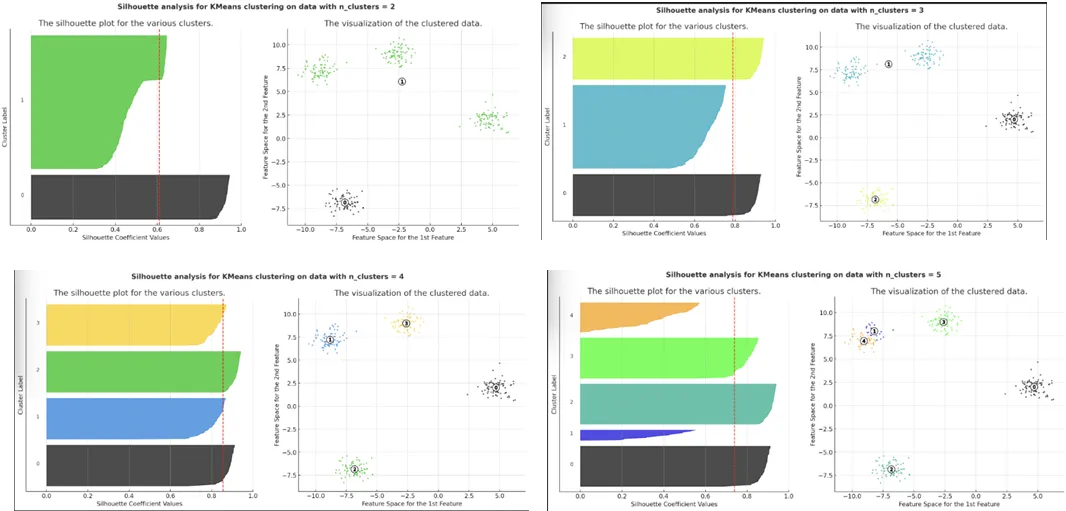
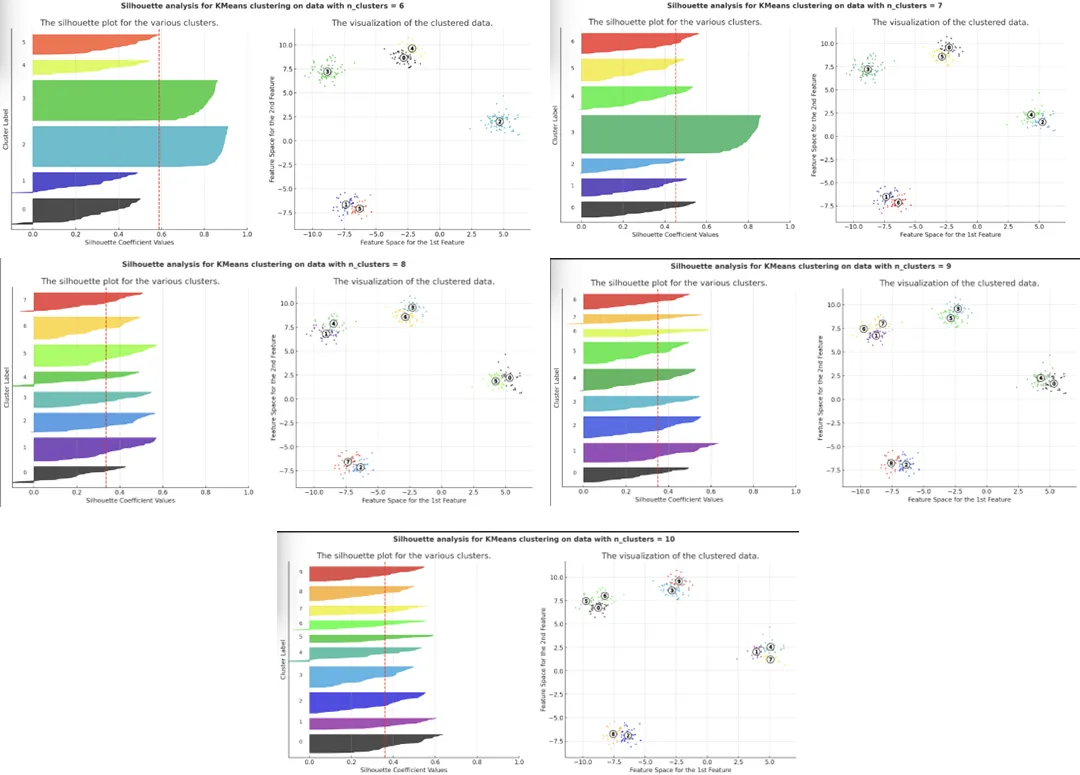
Python代码的结果
利用K-Means算法和轮廓分析进行的这次聚类分析,为合成数据集提供了聚类质量的深入评估。通过检查不同簇数量的聚类可视化和轮廓图,结果确定了最有效的聚类结构。
最佳簇数

分析结果显示,k=4是最佳选择,达到了最高的轮廓分数0.855。这一结果表明簇内紧凑性和簇间分离度之间达到了最佳平衡。
轮廓分数图和各个轮廓图都证实,四个簇在数据集中产生了最清晰的结构。
在k=4时,中间的轮廓图突出显示了以下特点:
- 大多数数据点的高轮廓系数反映了强簇内凝聚力。
- 由红色虚线标记的平均轮廓分数处于其峰值位置。
在k=4时,右侧的轮廓图也显著表现出:
- 簇间分离良好,簇区域之间重叠极少。
因此,通过将轮廓分数等定量指标与视觉图的定性评估相结合,该方法提供了一种确定最佳簇数的可靠方法。结果强调了轮廓分析作为无监督学习中评估和验证聚类质量的有力工具的价值。
结论
Silhouette对于评估K-Means聚类的质量既强大又直观。它通过平衡簇内凝聚力和簇间分离度来帮助确定最佳簇数。将Silhouette分析集成到你的聚类工作流程中,可以获得更准确和有意义的结果。


