平衡偏差与方差:解读模型中的权衡
2025年01月15日 由 alex 发表
2857
0
什么是偏差-方差权衡
偏差-方差权衡是机器学习中的一个基本概念,它强调了模型对新数据的泛化能力与其在训练数据上的性能之间的平衡。
偏差指的是通过简化模型来近似现实世界问题时所引入的误差。高偏差模型可能会欠拟合数据,意味着它错过了相关的模式并产生了过于简单的预测。
方差指的是模型对训练数据中波动的敏感性。高方差模型可能会过拟合,在捕捉信号的同时也捕捉到了噪声,从而导致对未见数据的泛化能力差。
目标是找到一个在偏差和方差之间取得适当平衡的模型,从而在训练数据和测试数据上都表现出良好的性能。
换句话说,就是要找到数据欠拟合和过拟合模型之间的平衡。
阐述这一概念
以下是一些Python代码,用于生成一个图表来帮助阐述这一概念:
import numpy as np
import matplotlib.pyplot as plt
# Generating sample data for the visualization
np.random.seed(3)
x = np.linspace(0, 5, 100)
y = 1 + 2 * np.sin(x) + np.random.randn(100)  # Simulated data
# Splitting data into training and testing sets
np.random.shuffle(x)
train_size = 70
x_train, x_test = x[:train_size], x[train_size:]
y_train, y_test = y[:train_size], y[train_size:]
# Model complexities (polynomial degrees)
degrees = [1, 3, 10]
plt.figure(figsize=(8, 6))
plt.scatter(x_train, y_train, color='black', label='Training data')
plt.scatter(x_test, y_test, color='red', label='Test data')
for degree in degrees:
    # Fit polynomial regression models of varying degrees
    coefficients = np.polyfit(x_train, y_train, degree)
    poly = np.poly1d(coefficients)
    y_pred_train = poly(x_train)
    y_pred_test = poly(x_test)

    # Calculate error (MSE) for both training and test sets
    mse_train = np.mean((y_pred_train - y_train) ** 2)
    mse_test = np.mean((y_pred_test - y_test) ** 2)

    # Plot the fitted curve
    x_range = np.linspace(0, 5, 100)
    plt.plot(x_range, poly(x_range), label=f'Degree {degree} (MSE={mse_test:.2f})')
plt.title('Bias-Variance Tradeoff')
plt.xlabel('X')
plt.ylabel('Y')
plt.legend()
plt.show()

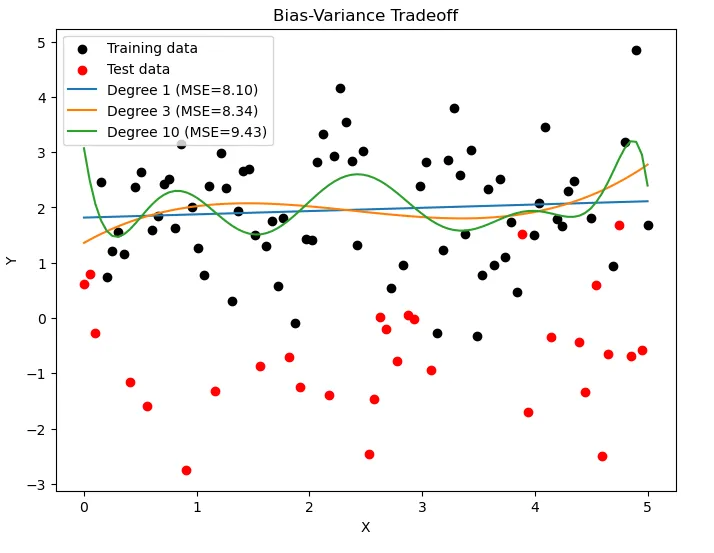
这段代码使用不同阶数(1、3和10)的多项式回归模型对样本数据进行拟合,生成了偏差-方差权衡图。
该图显示了训练数据集和测试数据集,以及每个多项式阶数的拟合曲线。
这说明了随着模型复杂度的增加,偏差和方差之间的权衡关系。调整阶数或使用不同的模型可以进一步展示这种权衡。
以下是另一个更具说明性的例子:
import numpy as np
import matplotlib.pyplot as plt
from sklearn.model_selection import train_test_split
from sklearn.preprocessing import PolynomialFeatures
from sklearn.linear_model import LinearRegression
from sklearn.metrics import mean_squared_error
# Generate synthetic data
np.random.seed(42)
X = np.random.rand(100, 1) * 6 - 3  # X values between [-3, 3]
y = np.sin(X) + np.random.randn(100, 1) * 0.1  # sin(x) + some noise
# Train/test split
X_train, X_test, y_train, y_test = train_test_split(X, y, test_size=0.2, random_state=42)
# Function to plot model predictions
def plot_model(degree, ax):
    poly = PolynomialFeatures(degree=degree)
    X_poly_train = poly.fit_transform(X_train)
    X_poly_test = poly.transform(X_test)

    model = LinearRegression()
    model.fit(X_poly_train, y_train)

    y_train_pred = model.predict(X_poly_train)
    y_test_pred = model.predict(X_poly_test)

    # Plot
    ax.scatter(X_train, y_train, color='blue', label='Training Data')
    ax.scatter(X_test, y_test, color='red', label='Test Data')

    X_range = np.linspace(-3, 3, 100).reshape(-1, 1)
    X_range_poly = poly.transform(X_range)
    y_range_pred = model.predict(X_range_poly)

    ax.plot(X_range, y_range_pred, color='green', label=f'Polynomial Degree {degree}')
    ax.legend()
    ax.set_title(f"Degree {degree}\nTrain MSE: {mean_squared_error(y_train, y_train_pred):.3f}, "
                 f"Test MSE: {mean_squared_error(y_test, y_test_pred):.3f}")

# Plot different polynomial degrees to show bias-variance tradeoff
fig, axs = plt.subplots(1, 3, figsize=(15, 5))
for i, degree in enumerate([1, 4, 15]):  # Linear, moderate, and high-degree polynomial
    plot_model(degree, axs[i])
plt.tight_layout()
plt.show()

在这段代码中,我们对一个带噪声的正弦波数据集拟合了不同阶数(1、4、15)的多项式回归模型。
- 阶数1:模型欠拟合数据(高偏差),导致在训练集和测试集上的表现都较差。
- 阶数4:模型捕捉到了数据的大致形状,既没有过拟合也没有欠拟合。这显示了偏差和方差之间的良好平衡。
- 阶数15:模型过拟合数据(高方差),导致在训练集上表现优异,但对测试集的泛化能力差。
在实践中,可以通过各种技术来管理偏差-方差权衡,如调整模型的复杂度、正则化方法、交叉验证或集成方法。
技术的选择取决于具体的问题和手头的数据集。
理解和可视化偏差-方差权衡有助于选择合适的模型复杂度,避免欠拟合和过拟合。
文章来源:https://medium.com/@thedatatwins/the-bias-variance-trade-off-understanding-the-balance-in-models-2dbdf6f6619f

欢迎关注ATYUN官方公众号
商务合作及内容投稿请联系邮箱:bd@atyun.com
热门企业
热门职位
写评论取消
回复取消


