使用Prophet库进行基于预测的时间序列异常检测
2025年01月17日 由 alex 发表
3777
0
时间序列异常检测在网络安全等广泛领域中发挥着至关重要的作用。为此目的,人们采用了各种方法。Boniol等人提出的过程为中心的分类法如下图所示。
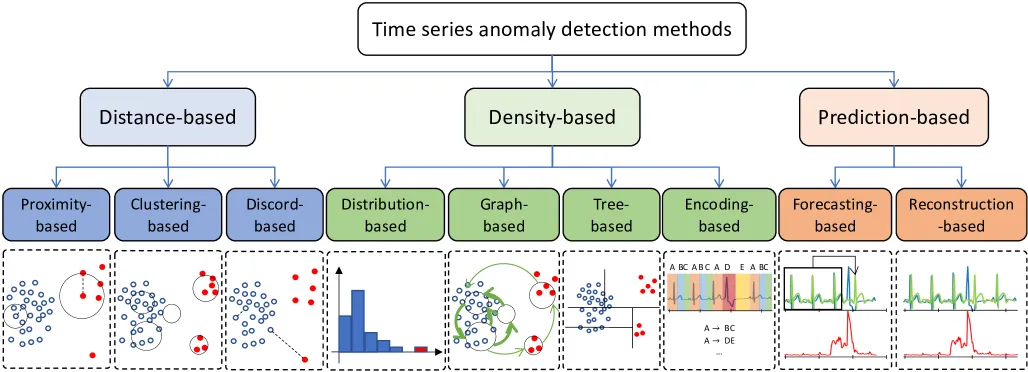
以下,我们使用Meta的Prophet库实现了一种基于预测的时间序列异常检测方法。Prophet是Facebook开发的一款强大工具,旨在处理具有趋势和季节性的时间序列数据。
方法
1. 数据预处理
数据集被结构化为两列:ds(日期/时间)和y(值)。数据清洗和格式化确保与Prophet库的兼容性。
2. 训练模型
对于每个时间点t,使用截至t的数据来训练一个Prophet模型。
此步骤涉及检测历史数据中的季节性模式和趋势,以预测下一个时间点。
3. 预测和误差计算
模型预测时间点t+1的下一个值。

预测误差计算为预测值与实际值之间的绝对差值:

4. 定义异常
根据预测误差的两个标准差设定一个动态阈值:

其中σ(e)是先前预测误差的标准差。
如果预测误差超过阈值θ,则时间步长t+1被标记为异常:

结果
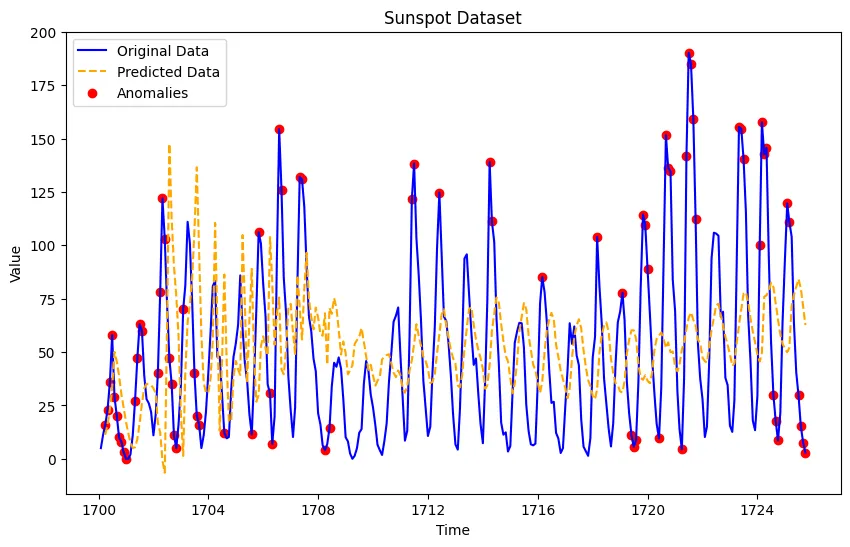
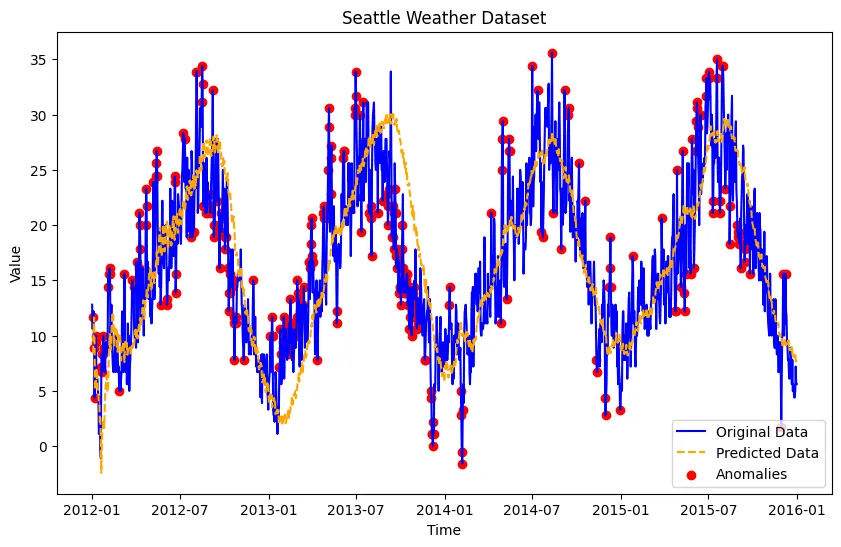
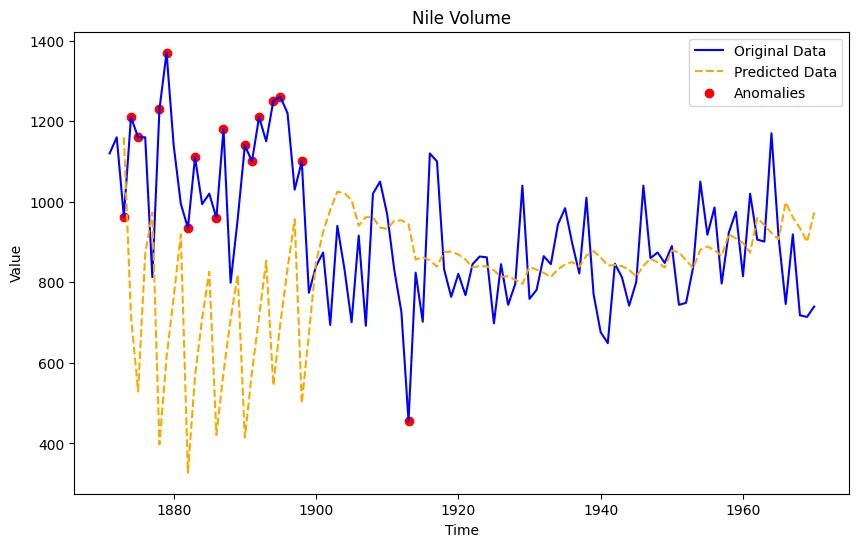
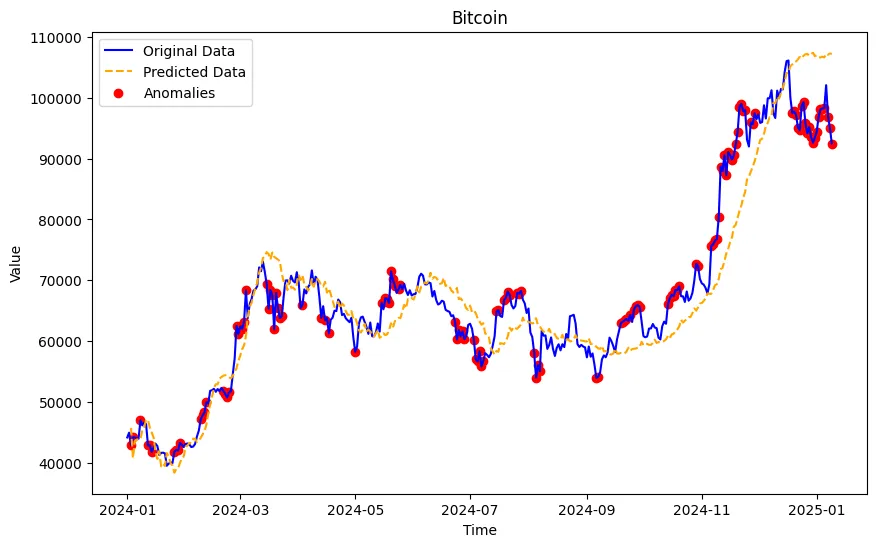
我们用不同的数据集进行测试。下图显示了原始数据上的异常点以及预测值。
结论
Prophet库是时间序列异常检测的多功能工具,尤其适用于具有潜在趋势和季节性模式的数据。它能自动处理季节性,因此适用于广泛的数据集。这种基本设置可作为简单异常检测案例的坚实基线。
然而,检测规则可以更加通用。此外,必须考虑初始预热期,因为Prophet需要足够的历史数据集才能生成可靠的预测。最后,应仔细考虑输入数据的变化特征和采样频率,以确保模型能有效适应不同的数据行为。
代码
import matplotlib.pyplot as plt
import numpy as np
from prophet import Prophet
import pandas as pd
import logging
# Suppress all logs from the `cmdstanpy` and `prophet` loggers
logging.getLogger('cmdstanpy').setLevel(logging.ERROR)
logging.getLogger('prophet').setLevel(logging.ERROR)
# 'data' is the entire dataset with 'ds' (datetime) and 'y' (value) columns
# List to store anomalies and prediction errors
anomalies = []
predicted_values = []
prediction_errors = []
# Step 1: Loop over all time steps t in the dataset
for t in range(2, len(data)):  # Start at 2, so we have data up to t-1
    # Use data from time 0 to time t-1 for training
    train_data = data[:t]
    # Fit the model on the training data up to time t-1
    model = Prophet()
    model.fit(train_data)
    # Step 2: Forecast the next time point (t)
    future = model.make_future_dataframe(periods=1)
    forecast = model.predict(future)
    # Get the predicted value for time t
    predicted_value = forecast['yhat'].iloc[-1]
    actual_value = data['y'].iloc[t]  # Actual value at time t (next time point)
    predicted_values.append(predicted_value)  # Store the predicted value
    # Step 3: Calculate the prediction error
    prediction_error = abs(predicted_value - actual_value)
    prediction_errors.append(prediction_error)
    # Step 4: Define a threshold (e.g., 2 standard deviations of prediction errors)
    threshold = 2 * np.std(prediction_errors)  # Adjust the threshold as necessary
    # Step 5: Detect anomalies (if the prediction error exceeds the threshold)
    if prediction_error > threshold:
        anomalies.append(data['ds'].iloc[t])  # Store the date of the anomaly
# Step 6: Plot the results
# Plot the original time series
plt.figure(figsize=(10, 6))
plt.plot(data['ds'], data['y'], label="Original Data", color='blue')
# Plot the predicted values (yhat) with a dashed line
plt.plot(data['ds'][2:], predicted_values, label="Predicted Data", color='orange', linestyle='--')
# Highlight anomalies
plt.scatter(anomalies, data.loc[data['ds'].isin(anomalies), 'y'], color='red', label='Anomalies')
# Add labels and title
#plt.title("Time Series with Anomalies Detected Based on Prediction Error")
plt.title("Bitcoin")
plt.xlabel("Time")
plt.ylabel("Value")
plt.legend()
# Display the plot
plt.show()
文章来源:https://medium.com/@ersinesen/prediction-based-time-series-anomaly-detection-with-prophet-library-da07593008a0

欢迎关注ATYUN官方公众号
商务合作及内容投稿请联系邮箱:bd@atyun.com
热门企业
热门职位
写评论取消
回复取消


