基于CLIP与Python的太阳能电池板视觉检查
太阳能电池板的效率直接影响可再生能源的生产,而污染和缺陷会显著降低其性能。本项目使用CLIP进行自动化的太阳能电池板检测。
CLIP(Contrastive Language-Image Pre-Training,对比语言-图像预训练)由OpenAI开发,利用大型语言模型(LLM)进行图像分类。这使得它特别适合太阳能电池板检测任务,因为它可以轻松适应各种缺陷类型,而无需进行大量重新训练。
使用计算机视觉对太阳能电池板进行预测性维护有几个任务,比如检测:1/覆盖光伏组件部分(从而降低效率)的物体,如鸟粪、雪或灰尘;2/组件的物理损坏,如面板破裂(通常是当有物体落在面板上时);3/腐蚀;或4/植被侵扰,即面板下方的植被长得过大,干扰到组件。
在本项目中,我们使用Hugging Face的Transformers库来访问CLIP模型。图像数据集来源于一组太阳能电池板图像,分为“干净”和“不干净”两类。
该图像集来自Kaggle。本项目受到Priyanka Kumari教程的启发。
我在使用kagglehub下载时遇到了很多麻烦。最后,我采用了传统的方式下载图像,以设置分析所需的文件夹结构。
我构建了模型,根据图像将光伏组件的状况分为6类之一。CLIP在这种方法下表现非常差,因为它基本上是衡量CLIP的答案与现有类别名称的接近程度。将问题设置为二分类问题后,CLIP的表现更好。
数据集使用TensorFlow的图像数据集工具进行加载和预处理。
import tensorflow as tf
import matplotlib.pyplot as plt
import numpy as np
from PIL import Image
from transformers import CLIPProcessor, CLIPModel
import torch
from sklearn.metrics import classification_report, confusion_matrix
import seaborn as sns
# Set image dimensions
img_height, img_width = 224, 224
# Load CLIP model and processor
model = CLIPModel.from_pretrained("openai/clip-vit-base-patch32")
processor = CLIPProcessor.from_pretrained("openai/clip-vit-base-patch32")
# Data augmentation
data_augmentation = tf.keras.Sequential([
    tf.keras.layers.RandomFlip("horizontal"),
    tf.keras.layers.RandomRotation(0.1),
    tf.keras.layers.RandomBrightness(0.2),
    tf.keras.layers.RandomContrast(0.2),
])
# Load datasets with augmentation
train_ds = tf.keras.utils.image_dataset_from_directory(
    '/content/binary_solar_panels/',
    validation_split=0.2,
    subset='training',
    image_size=(img_height, img_width),
    batch_size=32,
    seed=42
)
val_ds = tf.keras.utils.image_dataset_from_directory(
    '/content/binary_solar_panels/',
    validation_split=0.2,
    subset='validation',
    image_size=(img_height, img_width),
    batch_size=32,
    seed=42
)
class_names = train_ds.class_names
print("Classes:", class_names)
CLIP的一大优势在于其理解自然语言描述的能力。我们为每个类别定义了一组提示:
# More detailed and specific prompts
text_descriptions = [
    [
        "a pristine solar panel with perfectly clean surface",
        "a spotless solar panel in perfect condition",
        "a clean and well-maintained solar panel",
        "a solar panel with clear glass surface",
        "a brand new looking solar panel"
    ],
    [
        "a solar panel with visible dirt or damage",
        "a solar panel covered in bird droppings",
        "a damaged or faulty solar panel",
        "a dusty and dirty solar panel",
        "a solar panel with debris on surface"
    ]
]
predict_clip函数处理图像和文本提示以生成预测结果:
# Function to predict using CLIP with ensemble of prompts
def predict_clip(image_batch, temperature=100.0):
    images = [Image.fromarray(img.numpy().astype("uint8")) for img in image_batch]

    # Process images
    image_inputs = processor(
        images=images,
        return_tensors="pt",
        padding=True
    )

    # Initialize aggregated predictions
    total_predictions = np.zeros((len(images), 2))

    # Process each set of prompts
    with torch.no_grad():
        image_features = model.get_image_features(**image_inputs)
        image_features = image_features / image_features.norm(dim=-1, keepdim=True)

        for clean_prompt, not_clean_prompt in zip(text_descriptions[0], text_descriptions[1]):
            # Process text descriptions
            text_inputs = processor(
                text=[clean_prompt, not_clean_prompt],
                return_tensors="pt",
                padding=True
            )

            text_features = model.get_text_features(**text_inputs)
            text_features = text_features / text_features.norm(dim=-1, keepdim=True)

            # Calculate similarity with temperature scaling
            similarity = (temperature * image_features @ text_features.T).softmax(dim=-1)

            total_predictions += similarity.numpy()

    # Average predictions across all prompt pairs
    return total_predictions / len(text_descriptions[0])
# Evaluate model with different temperature values
temperatures = [50.0, 100.0, 150.0]
best_accuracy = 0
best_temperature = None
best_threshold = None
best_predictions = None
for temp in temperatures:
    print(f"\nTesting temperature: {temp}")
    y_true = []
    y_pred_probs = []

    for images, labels in val_ds:
        predictions = predict_clip(images, temperature=temp)
        y_true.extend(labels.numpy())
        y_pred_probs.extend(predictions[:, 1])

    y_true = np.array(y_true)
    y_pred_probs = np.array(y_pred_probs)

    # Try different thresholds
    thresholds = np.arange(0.3, 0.7, 0.05)
    for threshold in thresholds:
        y_pred = (y_pred_probs > threshold).astype(int)
        accuracy = np.mean(y_pred == y_true)

        if accuracy > best_accuracy:
            best_accuracy = accuracy
            best_temperature = temp
            best_threshold = threshold
            best_predictions = y_pred
print(f"\nBest temperature: {best_temperature}")
print(f"Best threshold: {best_threshold}")
print(f"Best accuracy: {best_accuracy:.3f}")
# Use best parameters for final evaluation
y_true = []
y_pred_probs = []
for images, labels in val_ds:
    predictions = predict_clip(images, temperature=best_temperature)
    y_true.extend(labels.numpy())
    y_pred_probs.extend(predictions[:, 1])
y_true = np.array(y_true)
y_pred_probs = np.array(y_pred_probs)
y_pred = (y_pred_probs > best_threshold).astype(int)
# Print classification report
print("\nClassification Report:")
print(classification_report(y_true, y_pred, target_names=class_names))
# Plot confusion matrix
plt.figure(figsize=(8, 6))
cm = confusion_matrix(y_true, y_pred)
sns.heatmap(cm, annot=True, fmt='d', cmap='Blues')
plt.title('Confusion Matrix')
plt.ylabel('True Label')
plt.xlabel('Predicted Label')
plt.xticks([0.5, 1.5], class_names)
plt.yticks([0.5, 1.5], class_names)
plt.show()
# Function to visualize predictions
def plot_predictions(dataset, num_images=25):
    plt.figure(figsize=(20, 20))
    for images, labels in dataset.take(1):
        predictions = predict_clip(images, temperature=best_temperature)
        predicted_classes = (predictions[:, 1] > best_threshold).astype(int)

        for i in range(min(num_images, len(images))):
            ax = plt.subplot(5, 5, i + 1)
            plt.imshow(images[i].numpy().astype("uint8"))

            predicted_class = class_names[predicted_classes[i]]
            actual_class = class_names[labels[i]]
            prob = predictions[i][1]

            color = 'green' if predicted_class == actual_class else 'red'
            plt.title(f"Actual: {actual_class}\nPred: {predicted_class}\nConf: {prob:.2f}",
                     color=color, fontsize=10)
            plt.axis("off")
    plt.tight_layout()
    plt.show()
# Plot sample predictions
plot_predictions(val_ds)
# Plot probability distributions
plt.figure(figsize=(10, 6))
clean_probs = y_pred_probs[y_true == 0]
not_clean_probs = y_pred_probs[y_true == 1]
plt.hist(clean_probs, alpha=0.5, label='Clean', bins=20, density=True)
plt.hist(not_clean_probs, alpha=0.5, label='Not Clean', bins=20, density=True)
plt.axvline(x=best_threshold, color='r', linestyle='--', label=f'Threshold ({best_threshold:.3f})')
plt.xlabel('Probability of Not Clean Class')
plt.ylabel('Density')
plt.title('Distribution of CLIP Probabilities')
plt.legend()
plt.show()
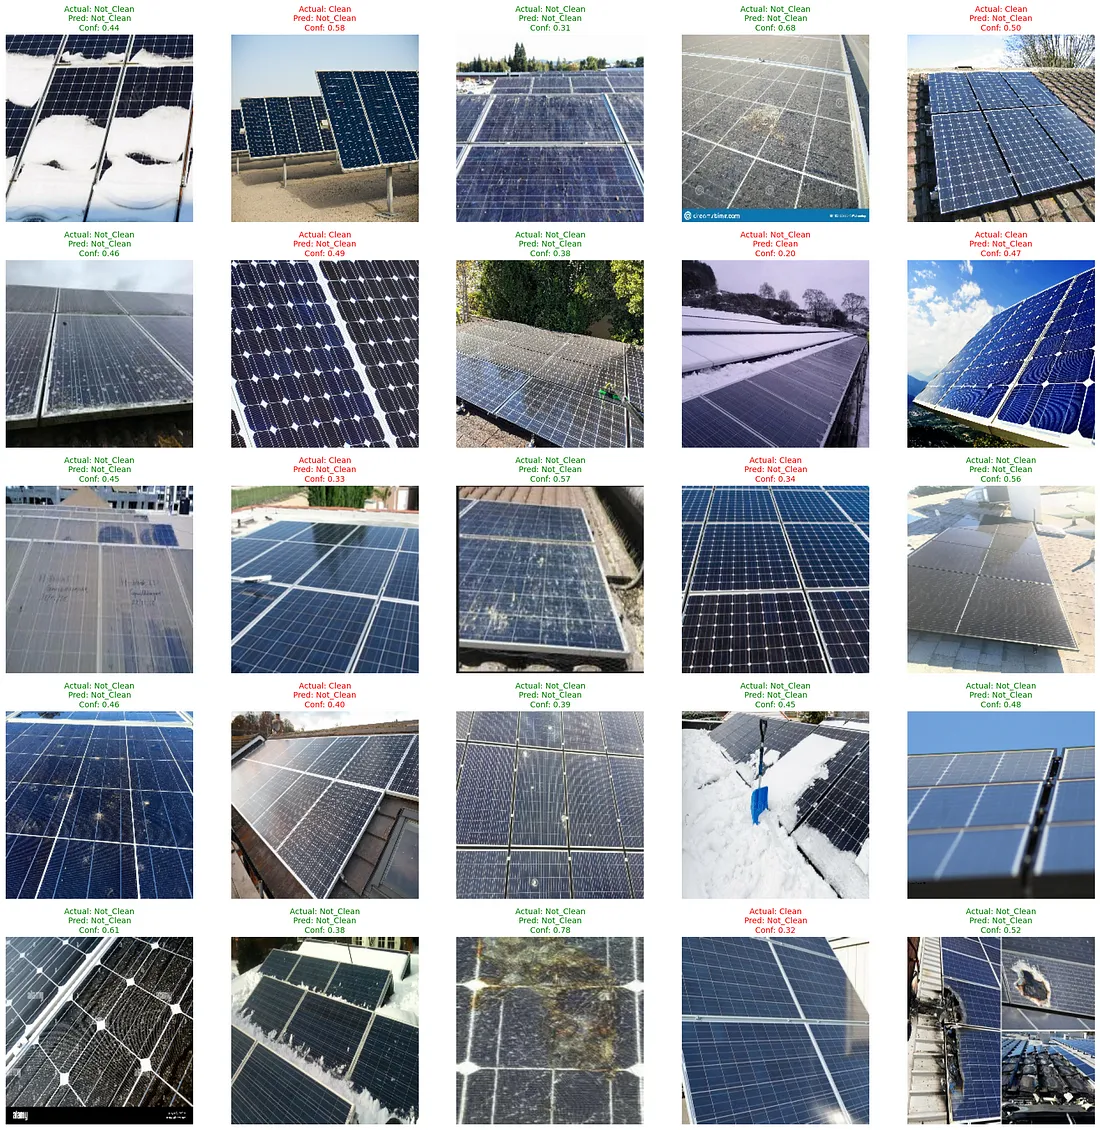
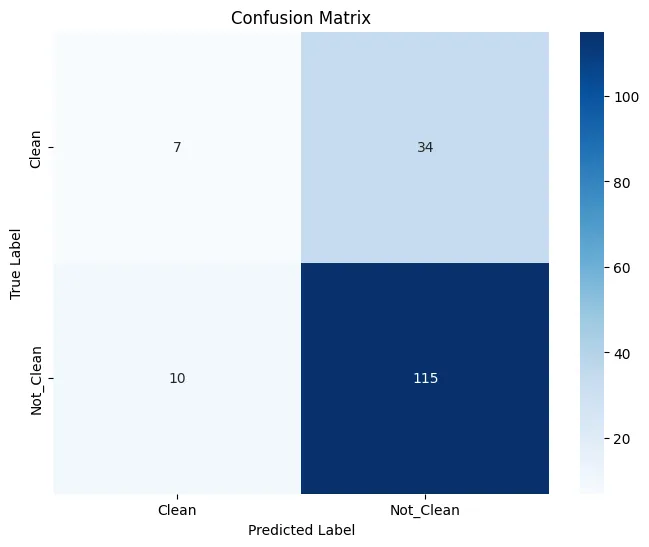
我们通过使用不同的温度值和阈值来评估模型的性能,以找到最佳配置。结果通过混淆矩阵和样本预测进行可视化展示。
该实现展示了CLIP在太阳能电池板缺陷检测中的有效性。其零样本学习能力使得仅需更新文本提示即可轻松适应新的缺陷类型。这种灵活性使得CLIP特别适合缺陷类别可能随时间演变的工业应用。
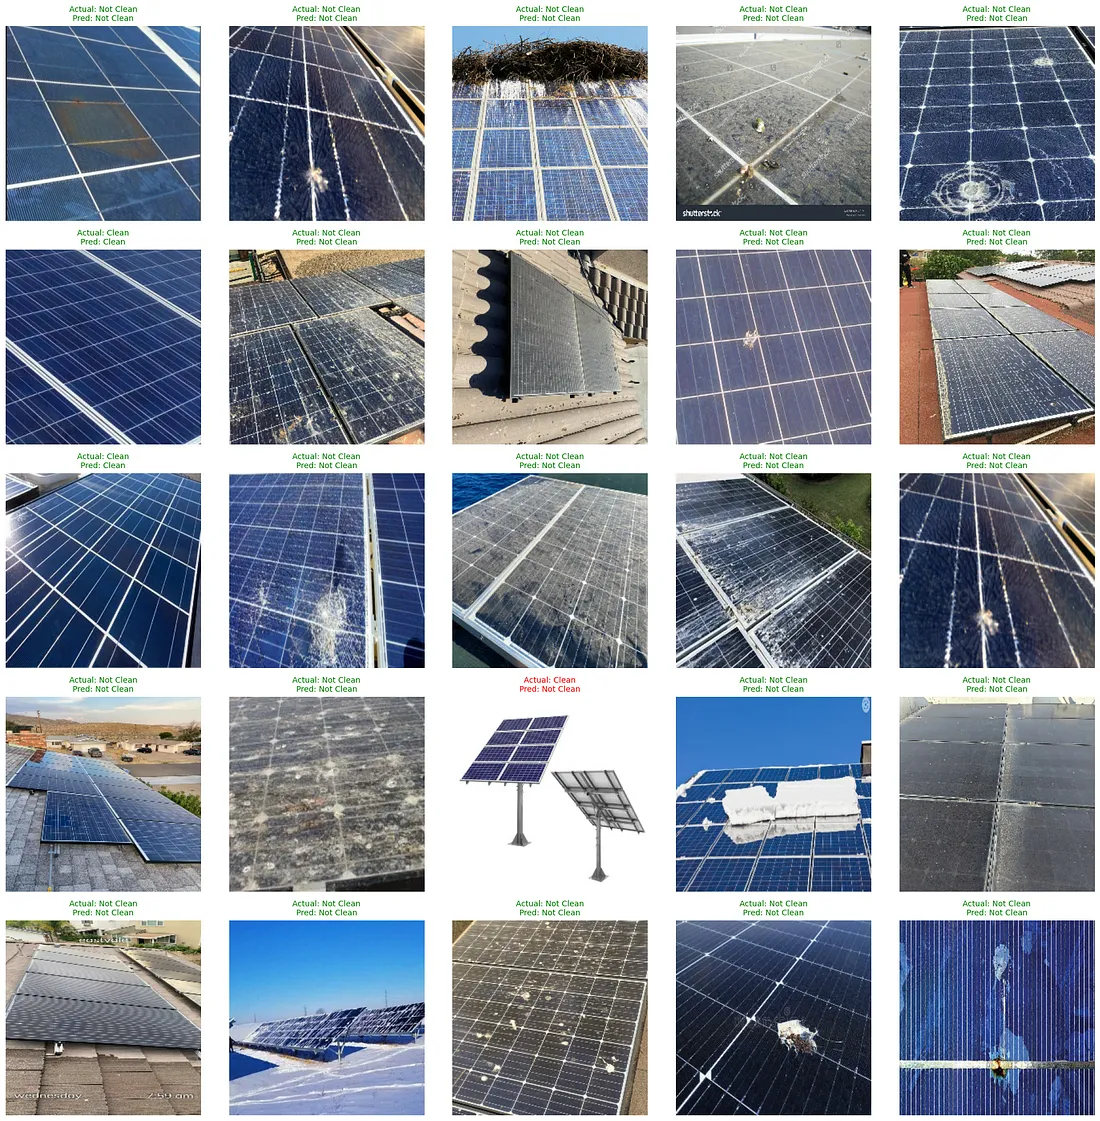
相比之下,使用MobileNetv2的迁移学习方法达到了0.87的准确率。Priyanka在教程中使用了VGG16。我发现MobileNetv2(mnv2)的准确率与之相当,并且在针对我们关注的太阳能电池板检测任务进行微调时速度要快得多。

技术考量
CLIP的性能对文本提示的选择较为敏感。最初,我为每个情况仅设置了一个提示,但这并不足够。模型的零样本学习能力使得无需重新训练即可轻松扩展到新的缺陷类型,但零样本学习的准确率低于监督学习。CLIP运行速度快,且无需训练。但相比自定义卷积神经网络(CNN)模型,其控制难度更大。
这一基于CLIP的解决方案为自动化太阳能电池板检测提供了灵活的基础,提供了可扩展的部署选项,并在不同的运行条件下保持了一致的性能。
Energy Robotics有一个关于无人机检测油罐的精彩视频。检测太阳能电场的方法与此类似。
完整的MobileNetV2实现
import tensorflow as tf
import matplotlib.pyplot as plt
import numpy as np
from sklearn.metrics import classification_report, confusion_matrix
import seaborn as sns
# Set image dimensions
img_height = 244
img_width = 244
# Load and split dataset
train_ds = tf.keras.utils.image_dataset_from_directory(
    '/content/a/Faulty_solar_panel/',
    validation_split=0.2,
    subset='training',
    image_size=(img_height, img_width),
    batch_size=32,
    seed=42,
    shuffle=True
)
val_ds = tf.keras.utils.image_dataset_from_directory(
    '/content/a/Faulty_solar_panel',
    validation_split=0.2,
    subset='validation',
    image_size=(img_height, img_width),
    batch_size=32,
    seed=42,
    shuffle=True
)
# Function to convert multi-class labels to binary (Clean vs Not Clean)
def to_binary_labels(images, labels):
    binary_labels = tf.where(labels == 1, 0, 1)  # Assuming 'Clean' is label 1
    return images, binary_labels
# Apply binary conversion to datasets
train_ds_binary = train_ds.map(to_binary_labels)
val_ds_binary = val_ds.map(to_binary_labels)
# Data preprocessing
AUTOTUNE = tf.data.AUTOTUNE
train_ds_binary = train_ds_binary.cache().shuffle(1000).prefetch(buffer_size=AUTOTUNE)
val_ds_binary = val_ds_binary.cache().prefetch(buffer_size=AUTOTUNE)
# Create the model
def create_model():
    base_model = tf.keras.applications.MobileNetV2(
        input_shape=(img_height, img_width, 3),
        include_top=False,
        weights='imagenet'
    )
    base_model.trainable = False
    model = tf.keras.Sequential([
        base_model,
        tf.keras.layers.GlobalAveragePooling2D(),
        tf.keras.layers.Dropout(0.2),
        tf.keras.layers.Dense(256, activation='relu'),
        tf.keras.layers.Dropout(0.5),
        tf.keras.layers.Dense(1, activation='sigmoid')  # Binary classification
    ])
    return model
# Create and compile model
model = create_model()
model.compile(
    optimizer=tf.keras.optimizers.Adam(learning_rate=0.001),
    loss='binary_crossentropy',
    metrics=['accuracy']
)
# Callbacks
early_stopping = tf.keras.callbacks.EarlyStopping(
    monitor='val_loss',
    patience=5,
    restore_best_weights=True
)
# Train the model
epochs = 20
history = model.fit(
    train_ds_binary,
    validation_data=val_ds_binary,
    epochs=epochs,
    callbacks=[early_stopping]
)
# Plot training results
plt.figure(figsize=(12, 4))
plt.subplot(1, 2, 1)
plt.plot(history.history['accuracy'], label='Training Accuracy')
plt.plot(history.history['val_accuracy'], label='Validation Accuracy')
plt.title('Model Accuracy')
plt.xlabel('Epoch')
plt.ylabel('Accuracy')
plt.legend()
plt.subplot(1, 2, 2)
plt.plot(history.history['loss'], label='Training Loss')
plt.plot(history.history['val_loss'], label='Validation Loss')
plt.title('Model Loss')
plt.xlabel('Epoch')
plt.ylabel('Loss')
plt.legend()
plt.tight_layout()
plt.show()
# Evaluate the model
y_true = []
y_pred = []
for images, labels in val_ds_binary:
    predictions = model.predict(images)
    y_true.extend(labels.numpy())
    y_pred.extend((predictions > 0.5).astype(int).flatten())
# Print classification report
print("\nClassification Report:")
print(classification_report(y_true, y_pred, target_names=['Clean', 'Not Clean']))
# Plot confusion matrix
cm = confusion_matrix(y_true, y_pred)
plt.figure(figsize=(8, 6))
sns.heatmap(cm, annot=True, fmt='d', cmap='Blues')
plt.title('Confusion Matrix')
plt.ylabel('True Label')
plt.xlabel('Predicted Label')
plt.xticks([0.5, 1.5], ['Clean', 'Not Clean'])
plt.yticks([0.5, 1.5], ['Clean', 'Not Clean'])
plt.show()
# Function to plot predictions
def plot_predictions(dataset, num_images=25):
    plt.figure(figsize=(20, 20))
    for images, labels in dataset.take(1):
        predictions = model.predict(images)
        for i in range(min(num_images, len(images))):
            ax = plt.subplot(5, 5, i + 1)
            plt.imshow(images[i].numpy().astype("uint8"))
            predicted_class = "Clean" if predictions[i] < 0.5 else "Not Clean"
            actual_class = "Clean" if labels[i] == 0 else "Not Clean"

            color = 'green' if predicted_class == actual_class else 'red'
            plt.title(f"Actual: {actual_class}\nPred: {predicted_class}",
                     color=color, fontsize=10)
            plt.axis("off")
    plt.tight_layout()
    plt.show()
# Plot sample predictions
plot_predictions(val_ds_binary)
