使用Python中的PCA、统计和LSTM进行时间序列预测性维护
预测性维护利用数据在故障发生前预测故障。目标很简单:尽早进行干预,以减少停机时间并避免不必要的维护。在本章中,我们将使用时间序列方法来监测来自喷气发动机的传感器数据,并检测出发动机出现问题的迹象。我们的数据来自美国国家航空航天局(NASA)的涡轮风扇发动机退化模拟数据集,该数据集模拟了多台发动机从运行到故障的过程。每台发动机由一个单元编号表示,每一行代表一个周期(即一个时间戳)。传感器记录压力、温度、振动以及其他各项测量数据。
这个数据集的特别之处在于,发动机一开始处于正常状态,然后随着时间的推移逐渐退化直至发生故障。这为我们提供了一种清晰的方式来比较各个周期。
我们将介绍七种技术:
1. 主成分分析(PCA),用于定义正常运行范围。
2. 时间序列预测,用于检测意外的变化趋势。
3. 利用多维传感器进行异常检测。
4. 基于序列的建模,用于标记进入故障状态的发动机。
5. 长短期记忆(LSTM)网络。
6. 基于注意力机制的序列模型。
7. 用于解释时间序列并与之交互的大语言模型(LLMs)。
让我们从加载美国国家航空航天局(NASA)的数据开始。
df = pd.read_csv("train_FD001.txt", sep="\s+", header=None)
df.dropna(axis=1, inplace=True)
df.columns = ['unit', 'time', 'op_setting_1', 'op_setting_2', 'op_setting_3'] + [f'sensor_{i}' for i in range(1, 22)]
rul = pd.read_csv("RUL_FD001.txt", header=None)
rul.columns = ['max_RUL']
rul['unit'] = rul.index + 1
last_cycle = df.groupby('unit')['time'].max().reset_index()
last_cycle.columns = ['unit', 'max_time']
df = df.merge(last_cycle, on='unit')
df['RUL'] = df['max_time'] - df['time']
df['distress'] = df['RUL'] < 20
selected_sensors = ['sensor_9', 'sensor_14', 'sensor_4', 'sensor_3', 'sensor_17', 'sensor_2']
# -----------------------------
# PCA
# -----------------------------
scaler = StandardScaler()
X_scaled = scaler.fit_transform(df[selected_sensors])
pca = PCA(n_components=3)
pca_factors = pca.fit_transform(X_scaled)
df[['pca_1', 'pca_2', 'pca_3']] = pca_factors
每台发动机运行的周期数各不相同。我们将利用这种差异,给每一行数据标注上距离故障还剩多少个周期,这被称为剩余使用寿命(RUL)。但首先,我们要定义一下相关方法。
用于确定健康范围的主成分分析(PCA)
目标:利用低维空间来定义“健康”状态的样子。然后检测机器何时偏离该状态过远。
原理:大多数发动机在新的时候运行情况类似。通过学习健康发动机的压缩表示形式,我们可以追踪一台机器随着时间的推移偏离该状态空间有多远。
我们将每台发动机的前30个周期定义为“健康”状态:
# -----------------------------
# PCA for Healthy Boundaries (Visualization)
# -----------------------------
healthy_df = df[df['time'] <= 30]
X_pca = healthy_df[['pca_1', 'pca_2']].values
center = X_pca.mean(axis=0)
df['pca_distance'] = np.linalg.norm(df[['pca_1', 'pca_2']].values - center, axis=1)
threshold = df['pca_distance'].mean() + 3 * df['pca_distance'].std()
df['pca_anomaly'] = df['pca_distance'] > threshold
plt.figure(figsize=(8, 4))
plt.scatter(X_pca[:, 0], X_pca[:, 1], alpha=0.3)
plt.title('PCA of Healthy Operation')
plt.xlabel('PC1')
plt.ylabel('PC2')
plt.grid(False)
plt.savefig("pca_healthy_bounds.png")
plt.close()
我们先对传感器数据进行标准化处理,然后使用主成分分析(PCA)将传感器数据降维到三维。
我们计算每个数据点与健康运行状态中心的距离。
任何偏离健康数据簇较远的发动机运行周期都可以被标记出来。当传感器在健康运行状态下表现相似时,这种方法效果最佳。
利用时间序列模型预测传感器数据变化趋势
目标:使用统计时间序列模型来预测传感器数据。如果预测值与实际值出现偏差,那么发动机可能正在逐渐走向故障。
预测是基于过去的运行模式会持续这一假设。当这一假设不成立时,模型的误差就会增大,而这可能就是发动机性能下降的信号。让我们在一台发动机以及主成分分析(PCA)的一个维度上使用一个简单的自回归积分滑动平均模型(ARIMA)。
# -----------------------------
# Time Series Modeling (ARIMA with PCA)
# -----------------------------
unit_df = df[df['unit'] == 1]
model = sm.tsa.ARIMA(unit_df['pca_1'], order=(1, 1, 1))
fit = model.fit()
forecast = fit.predict(start=1, end=len(unit_df), dynamic=False)
residuals = unit_df['pca_1'].iloc[1:].values - forecast[1:]
plt.figure(figsize=(8, 4))
plt.plot(residuals)
plt.axhline(y=2 * residuals.std(), color='r', linestyle='--')
plt.title('ARIMA Residuals on PCA_1')
plt.savefig("arima_residuals_pca1.png")
plt.close()
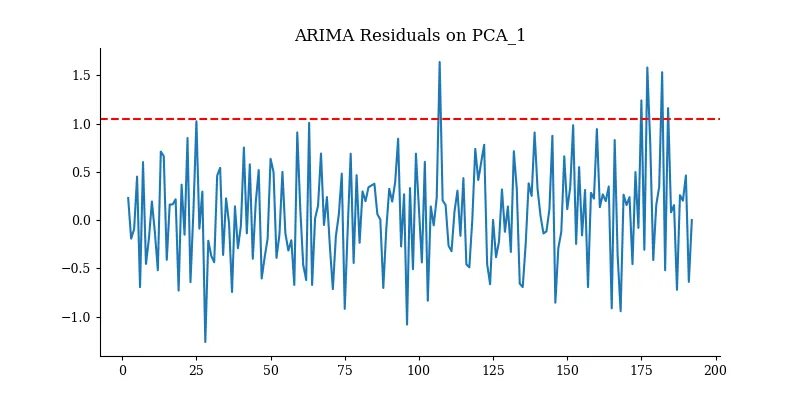
较大的残差是危险信号。我们可以随着时间推移监测残差的方差,或者设定一条规则:如果误差超过2个标准差,就发出警报。
使用孤立森林算法进行异常检测
目标:根据传感器读数的多元分布,自动标记出异常行为。
原理:孤立森林算法是将异常值隔离开来,而不是对正常行为进行建模。在没有可用标签的情况下,它也能很好地发挥作用。
from sklearn.ensemble import IsolationForest
# -----------------------------
# Anomaly Detection (Isolation Forest on PCA)
# -----------------------------
pca_features = df[['pca_1', 'pca_2', 'pca_3']].values
clf = IsolationForest(contamination=0.05, random_state=42)
df['anomaly_iforest'] = clf.fit_predict(pca_features) == -1
plt.figure(figsize=(8, 4))
plt.hist(df['pca_distance'], bins=50, alpha=0.6, label='PCA Distance')
plt.axvline(threshold, color='red', linestyle='--', label='Threshold')
plt.title('Isolation Forest Anomalies')
plt.legend()
plt.savefig("iforest_anomaly_pca.png")
plt.show()
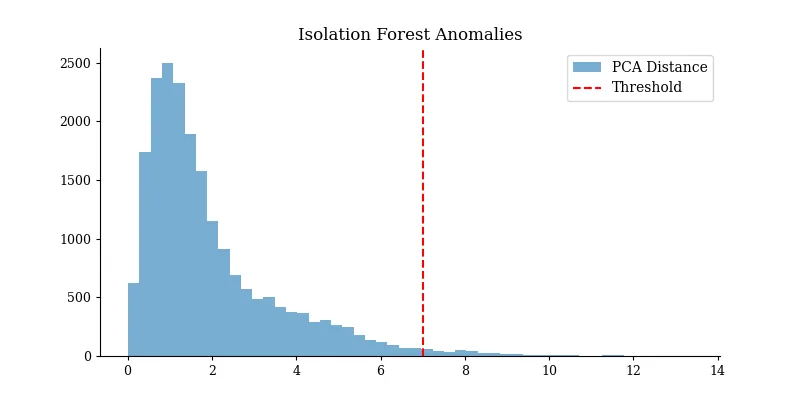
你现在可以将孤立森林检测到的异常与实际 RUL 值进行比较,以查看警报是否发生得足够早。
序列建模以标记处于困境中的发动机
目标:不仅检测孤立的异常值,还要检测表明发动机即将发生故障的序列。
原理:故障不会突然发生。相反,它们会逐渐出现 — 传感器漂移、振动持续增加等。序列模型让我们从数据中学习这些模式。
首先,计算剩余使用寿命(RUL):
import numpy as np
from sklearn.model_selection import train_test_split
from sklearn.ensemble import RandomForestClassifier
def make_sequences(df, sensor, window=30):
    sequences, labels = [], []
    for _, group in df.groupby('unit'):
        values = group[sensor].values
        targets = group['distress'].values
        for i in range(len(values) - window):
            sequences.append(values[i:i+window])
            labels.append(targets[i+window])
    return np.array(sequences), np.array(labels)
X_seq, y_seq = make_sequences(df, 'sensor_9')
X_train_rf, X_test_rf, y_train_rf, y_test_rf = train_test_split(X_seq, y_seq, test_size=0.2, random_state=42)
rf_clf = RandomForestClassifier(n_estimators=100)
rf_clf.fit(X_train_rf, y_train_rf)
# Visualization of prediction probabilities
y_pred_rf = rf_clf.predict_proba(X_test_rf)[:, 1]
plt.figure(figsize=(8, 4))
plt.hist(y_pred_rf, bins=30, alpha=0.7)
plt.title('Random Forest Distress Probabilities')
plt.xlabel('Predicted Probability')
plt.ylabel('Frequency')
plt.savefig("rf_sequence_classification.png")
plt.close()
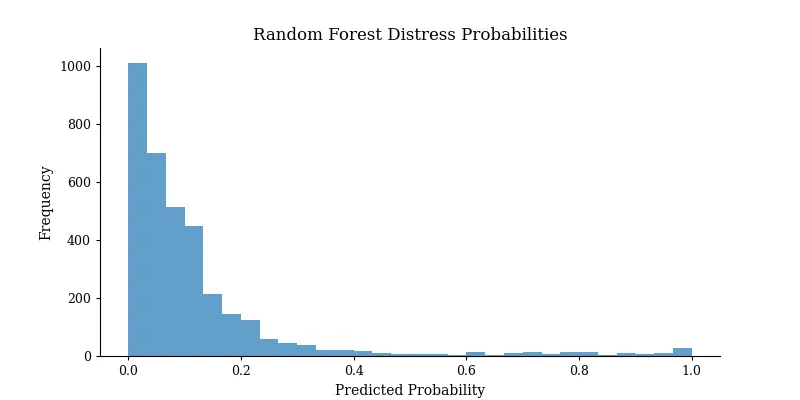
这种方法可以标记出异常值,并了解那些通常会导致故障的传感器读数变化过程。
我们已经了解了主成分分析(PCA)、统计预测以及经典的异常检测方法是如何帮助发现故障早期迹象的。然而,当信号隐藏在长程依赖关系中,或者存在于多个传感器呈现出的微妙趋势里时,这些方法往往就不够用了。而这正是深度学习的优势所在。
长短期记忆(LSTM)
目标:学习传感器读数序列中那些表明发动机即将出现故障的隐藏模式。
长短期记忆(LSTM)网络旨在捕捉长程依赖关系。它们能够记住过去的信号,同时遗忘掉无关的噪声,这使得它们非常擅长检测随着时间推移而逐渐显现的趋势。
我们将使用一段窗口内的传感器数据作为输入,来预测发动机是否正在接近故障状态。
# -----------------------------
# PCA-based LSTM
# -----------------------------
def make_pca_lstm_sequences(df, pca_cols, window=30):
    sequences, labels = [], []
    for _, group in df.groupby('unit'):
        values = group[pca_cols].values
        targets = group['distress'].values
        for i in range(len(values) - window):
            sequences.append(values[i:i+window])
            labels.append(targets[i+window])
    return np.array(sequences), np.array(labels)
pca_cols = ['pca_1', 'pca_2', 'pca_3']
X, y = make_pca_lstm_sequences(df, pca_cols)
X_train, X_test, y_train, y_test = train_test_split(X, y, test_size=0.2, random_state=42)
# LSTM
model_lstm = Sequential()
model_lstm.add(LSTM(64, input_shape=(X.shape[1], X.shape[2])))
model_lstm.add(Dense(1, activation='sigmoid'))
model_lstm.compile(optimizer='adam', loss='binary_crossentropy', metrics=['accuracy'])
model_lstm.fit(X_train, y_train, epochs=10, batch_size=32, validation_split=0.1)
pred_lstm = model_lstm.predict(X_test).flatten()
plt.figure(figsize=(8, 4))
plt.plot(pred_lstm, alpha=0.8)
plt.title('LSTM Distress Predictions')
plt.xlabel('Sample Index')
plt.ylabel('Predicted Probability')
plt.savefig("lstm_predictions.png")
plt.close()
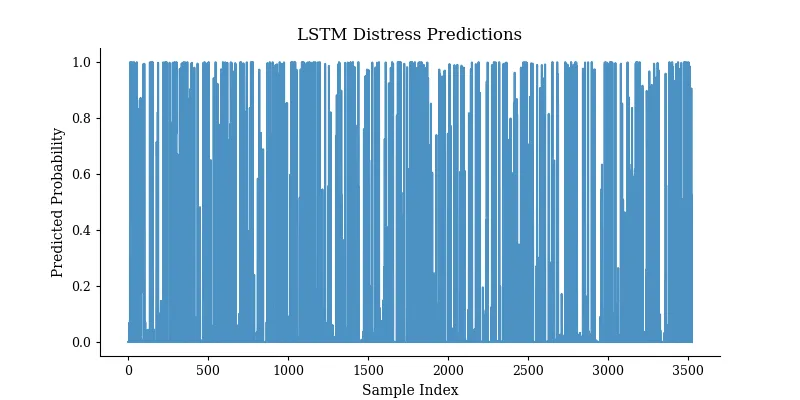
这个模型会学习一个30个周期的序列是否以出现故障状态结束。你可以在测试集上对其进行评估,或者在实际生产中用它来标记出现故障的发动机。
我们将把长短期记忆(LSTM)模型应用于一台特定的发动机,并在其整个使用周期内跟踪它出现故障的预测概率。
# Predict and compare for a specific engine
unit_id = 3
window = 30
engine_data = df[df['unit'] == unit_id].copy()
X_engine = np.array([engine_data[['pca_1', 'pca_2', 'pca_3']].values[i:i+window] for i in range(len(engine_data) - window)])
cycles = engine_data['time'].values[window:]
# LSTM prediction
pred_lstm_engine = model_lstm.predict(X_engine).flatten()
# Plot LSTM only
plt.figure(figsize=(10, 4))
plt.plot(cycles, pred_lstm_engine, label='LSTM')
plt.axhline(0.5, color='red', linestyle='--', linewidth=0.8, label='Threshold')
plt.title(f'LSTM Distress Prediction for Engine {unit_id}')
plt.xlabel('Cycle')
plt.ylabel('Distress Probability')
plt.legend()
plt.tight_layout()
plt.savefig("lstm_engine_prediction.png")
plt.close()
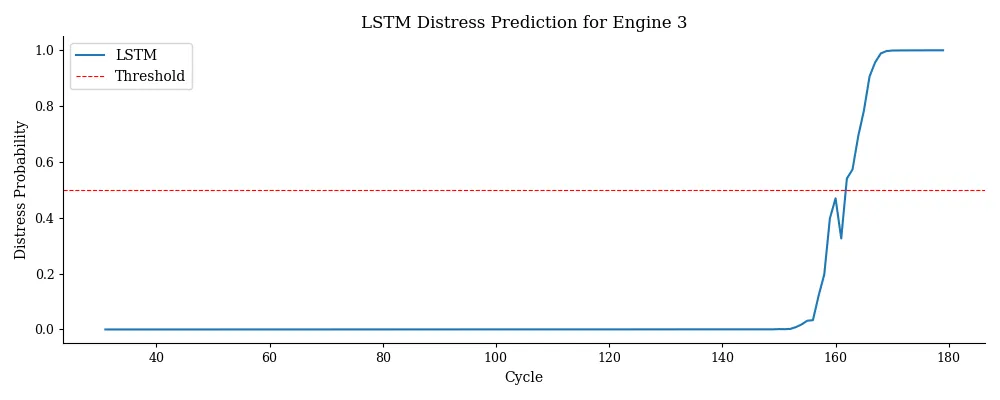
这张图表告诉我们模型何时开始察觉到危险。如果它能足够早地超过0.5的阈值,那对于预测性维护来说就是一次成功。
基于注意力机制的模型
目标:让模型在进行预测时能够聚焦于序列中最重要的部分。
原理:注意力机制使模型能够“回顾”一个序列,并根据每个点与当前预测的相关性来对其进行加权。在只有部分历史信息起作用的序列任务中,这通常能提高模型的性能。
我们将为一个序列模型构建一个自定义的注意力层。
# -----------------------------
# LSTM + Attention
# -----------------------------
class AttentionWithWeights(Layer):
    def build(self, input_shape):
        self.W = self.add_weight(shape=(input_shape[-1], 1), initializer='random_normal')
    def call(self, inputs):
        scores = tf.matmul(inputs, self.W)
        weights = tf.nn.softmax(scores, axis=1)
        context = tf.reduce_sum(inputs * weights, axis=1)
        return context, weights
input_seq = Input(shape=(X.shape[1], X.shape[2]))
x = LSTM(64, return_sequences=True)(input_seq)
context, attn_weights = AttentionWithWeights()(x)
output = Dense(1, activation='sigmoid', name='pred')(context)
model_attn = Model(inputs=input_seq, outputs={'pred': output, 'attn': attn_weights})
model_attn.compile(
    optimizer='adam',
    loss={'pred': 'binary_crossentropy'},
    metrics={'pred': 'accuracy'}
)
model_attn.fit(X_train, {'pred': y_train}, epochs=10, batch_size=32, validation_split=0.1)
# Plot LSTM + Attention only
plt.figure(figsize=(10, 4))
plt.plot(cycles, pred_attn_engine, label='LSTM + Attention')
plt.axhline(0.5, color='red', linestyle='--', linewidth=0.8, label='Threshold')
plt.title(f'LSTM + Attention Prediction for Engine {unit_id}')
plt.xlabel('Cycle')
plt.ylabel('Distress Probability')
plt.legend()
plt.tight_layout()
plt.savefig("lstm_attention_engine_prediction.png")
plt.close()
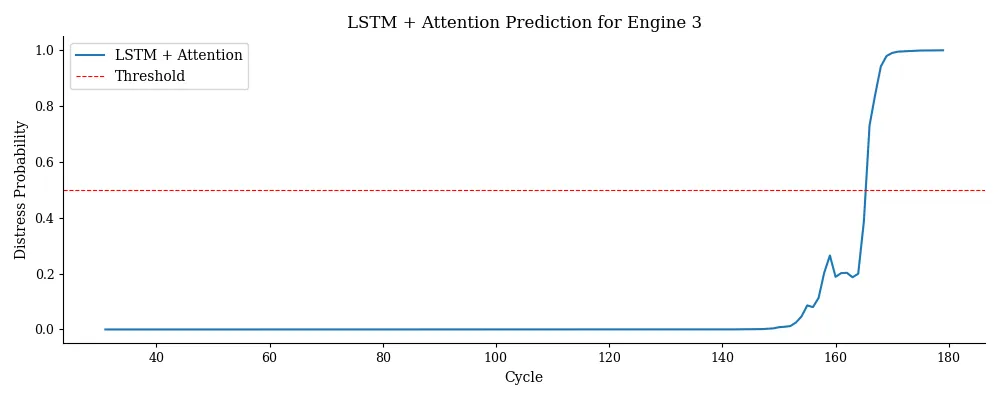
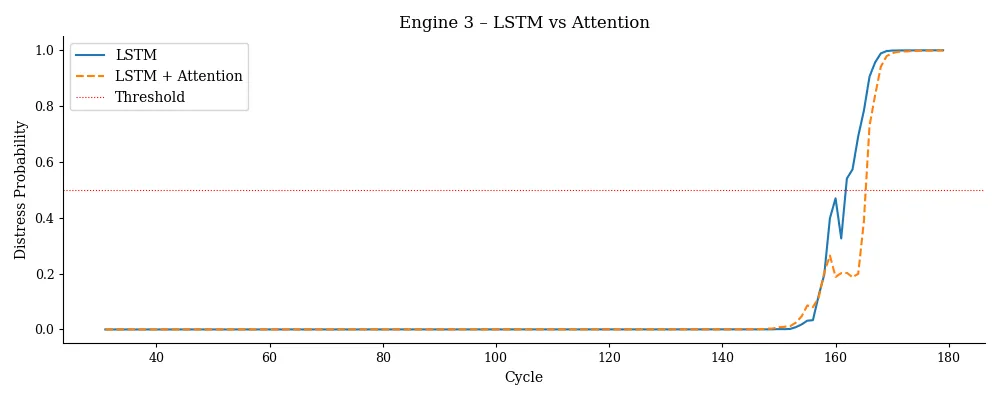
这个模型会学习在预测故障时,序列中的哪些部分最为关键。你可以将注意力权重可视化,从而解释模型发出警报的原因。
这些图表让模型更易于解释、调试和让人信赖,而这对于将深度学习应用于预测性维护来说是至关重要的步骤。
在预测性维护中,可解释性非常重要。工程师们想知道为什么模型会认为一台机器出现了问题。这些可视化结果为你打开了一扇了解模型逻辑的窗口:
- 随着时间推移的长短期记忆(LSTM)预测结果能显示出模型何时察觉到问题。
- 注意力权重能显示出模型关注的重点在哪里。
有了这些工具,你不仅能构建一个模型,还能构建一个工程师们信任并依赖的系统。
那又怎样呢?
预测性维护处于领域知识、统计学和机器学习的交叉领域。现实世界并不总是线性的,机器也很少会突然同时出现故障。时间序列为我们提供了一种描述系统如何演变以及如何出现故障的方式。
主成分分析(PCA)有助于界定健康运行的边界。我们可以使用时间序列预测来确定系统何时偏离了其正常运行状态。我们可以使用无监督异常检测在无需标签的情况下捕捉异常值。
序列模型能够检测出长期的性能退化情况。基于长短期记忆(LSTM)和注意力机制的深度学习能够发现复杂而微妙的预警信号。
这种多层级的策略能让你在各个层面都获得洞察力,从快速发出警报,到进行长期趋势预测。而这恰恰就是预测性维护所需要的。
完整代码
# predictive_maintenance.py
import pandas as pd
import numpy as np
import matplotlib.pyplot as plt
from sklearn.preprocessing import StandardScaler
from sklearn.decomposition import PCA
from sklearn.ensemble import IsolationForest, RandomForestClassifier
from sklearn.model_selection import train_test_split
import statsmodels.api as sm
from tensorflow.keras.models import Sequential
from tensorflow.keras.layers import LSTM, Dense
from tensorflow.keras.models import Model
from tensorflow.keras.layers import Input, Layer
import tensorflow as tf
# Custom minimalist plot style
plt.rcParams.update({
'font.family': 'serif',
'axes.spines.top': False,
'axes.spines.right': False,
'axes.spines.left': True,
'axes.spines.bottom': True,
'axes.linewidth': 0.8,
'xtick.major.size': 3,
'ytick.major.size': 3,
'axes.titlesize': 12,
'axes.labelsize': 10,
'xtick.labelsize': 9,
'ytick.labelsize': 9
})
# -----------------------------
# Load and preprocess data
# -----------------------------
df = pd.read_csv("train_FD001.txt", sep="\s+", header=None)
df.dropna(axis=1, inplace=True)
df.columns = ['unit', 'time', 'op_setting_1', 'op_setting_2', 'op_setting_3'] + [f'sensor_{i}' for i in range(1, 22)]
rul = pd.read_csv("RUL_FD001.txt", header=None)
rul.columns = ['max_RUL']
rul['unit'] = rul.index + 1
last_cycle = df.groupby('unit')['time'].max().reset_index()
last_cycle.columns = ['unit', 'max_time']
df = df.merge(last_cycle, on='unit')
df['RUL'] = df['max_time'] - df['time']
df['distress'] = df['RUL'] < 20
selected_sensors = ['sensor_9', 'sensor_14', 'sensor_4', 'sensor_3', 'sensor_17', 'sensor_2']
# -----------------------------
# PCA
# -----------------------------
scaler = StandardScaler()
X_scaled = scaler.fit_transform(df[selected_sensors])
pca = PCA(n_components=3)
pca_factors = pca.fit_transform(X_scaled)
df[['pca_1', 'pca_2', 'pca_3']] = pca_factors
# -----------------------------
# PCA for Healthy Boundaries (Visualization)
# -----------------------------
healthy_df = df[df['time'] <= 30]
X_pca = healthy_df[['pca_1', 'pca_2']].values
center = X_pca.mean(axis=0)
df['pca_distance'] = np.linalg.norm(df[['pca_1', 'pca_2']].values - center, axis=1)
threshold = df['pca_distance'].mean() + 3 * df['pca_distance'].std()
df['pca_anomaly'] = df['pca_distance'] > threshold
plt.figure(figsize=(8, 4))
plt.scatter(X_pca[:, 0], X_pca[:, 1], alpha=0.3)
plt.title('PCA of Healthy Operation')
plt.xlabel('PC1')
plt.ylabel('PC2')
plt.grid(False)
plt.savefig("pca_healthy_bounds.png")
plt.close()
# -----------------------------
# Time Series Modeling (ARIMA with PCA)
# -----------------------------
unit_df = df[df['unit'] == 1]
model = sm.tsa.ARIMA(unit_df['pca_1'], order=(1, 1, 1))
fit = model.fit()
forecast = fit.predict(start=1, end=len(unit_df), dynamic=False)
residuals = unit_df['pca_1'].iloc[1:].values - forecast[1:]
plt.figure(figsize=(8, 4))
plt.plot(residuals)
plt.axhline(y=2 * residuals.std(), color='r', linestyle='--')
plt.title('ARIMA Residuals on PCA_1')
plt.savefig("arima_residuals_pca1.png")
plt.close()
# -----------------------------
# Anomaly Detection (Isolation Forest on PCA)
# -----------------------------
pca_features = df[['pca_1', 'pca_2', 'pca_3']].values
clf = IsolationForest(contamination=0.05, random_state=42)
df['anomaly_iforest'] = clf.fit_predict(pca_features) == -1
plt.figure(figsize=(8, 4))
plt.hist(df['pca_distance'], bins=50, alpha=0.6, label='PCA Distance')
plt.axvline(threshold, color='red', linestyle='--', label='Threshold')
plt.title('Isolation Forest Anomalies')
plt.legend()
plt.savefig("iforest_anomaly_pca.png")
plt.close()
# -----------------------------
# Sequence Classification (Random Forest)
# -----------------------------
def make_sequences(df, sensor, window=30):
sequences, labels = [], []
for _, group in df.groupby('unit'):
values = group[sensor].values
targets = group['distress'].values
for i in range(len(values) - window):
sequences.append(values[i:i+window])
labels.append(targets[i+window])
return np.array(sequences), np.array(labels)
X_seq, y_seq = make_sequences(df, 'sensor_9')
X_train_rf, X_test_rf, y_train_rf, y_test_rf = train_test_split(X_seq, y_seq, test_size=0.2, random_state=42)
rf_clf = RandomForestClassifier(n_estimators=100)
rf_clf.fit(X_train_rf, y_train_rf)
# Visualization of prediction probabilities
y_pred_rf = rf_clf.predict_proba(X_test_rf)[:, 1]
plt.figure(figsize=(8, 4))
plt.hist(y_pred_rf, bins=30, alpha=0.7)
plt.title('Random Forest Distress Probabilities')
plt.xlabel('Predicted Probability')
plt.ylabel('Frequency')
plt.savefig("rf_sequence_classification.png")
plt.close()
# -----------------------------
# PCA-based LSTM
# -----------------------------
def make_pca_lstm_sequences(df, pca_cols, window=30):
sequences, labels = [], []
for _, group in df.groupby('unit'):
values = group[pca_cols].values
targets = group['distress'].values
for i in range(len(values) - window):
sequences.append(values[i:i+window])
labels.append(targets[i+window])
return np.array(sequences), np.array(labels)
pca_cols = ['pca_1', 'pca_2', 'pca_3']
X, y = make_pca_lstm_sequences(df, pca_cols)
X_train, X_test, y_train, y_test = train_test_split(X, y, test_size=0.2, random_state=42)
# LSTM
model_lstm = Sequential()
model_lstm.add(LSTM(64, input_shape=(X.shape[1], X.shape[2])))
model_lstm.add(Dense(1, activation='sigmoid'))
model_lstm.compile(optimizer='adam', loss='binary_crossentropy', metrics=['accuracy'])
model_lstm.fit(X_train, y_train, epochs=10, batch_size=32, validation_split=0.1)
pred_lstm = model_lstm.predict(X_test).flatten()
plt.figure(figsize=(8, 4))
plt.plot(pred_lstm, alpha=0.8)
plt.title('LSTM Distress Predictions')
plt.xlabel('Sample Index')
plt.ylabel('Predicted Probability')
plt.savefig("lstm_predictions.png")
plt.close()
# -----------------------------
# LSTM + Attention
# -----------------------------
class AttentionWithWeights(Layer):
def build(self, input_shape):
self.W = self.add_weight(shape=(input_shape[-1], 1), initializer='random_normal')
def call(self, inputs):
scores = tf.matmul(inputs, self.W)
weights = tf.nn.softmax(scores, axis=1)
context = tf.reduce_sum(inputs * weights, axis=1)
return context, weights
input_seq = Input(shape=(X.shape[1], X.shape[2]))
x = LSTM(64, return_sequences=True)(input_seq)
context, attn_weights = AttentionWithWeights()(x)
output = Dense(1, activation='sigmoid', name='pred')(context)
model_attn = Model(inputs=input_seq, outputs={'pred': output, 'attn': attn_weights})
model_attn.compile(
optimizer='adam',
loss={'pred': 'binary_crossentropy'},
metrics={'pred': 'accuracy'}
)
model_attn.fit(X_train, {'pred': y_train}, epochs=10, batch_size=32, validation_split=0.1)
# Predict and compare for a specific engine
unit_id = 3
window = 30
engine_data = df[df['unit'] == unit_id].copy()
X_engine = np.array([engine_data[['pca_1', 'pca_2', 'pca_3']].values[i:i+window] for i in range(len(engine_data) - window)])
cycles = engine_data['time'].values[window:]
# LSTM prediction
pred_lstm_engine = model_lstm.predict(X_engine).flatten()
# LSTM + Attention prediction
pred_dict = model_attn.predict(X_engine)
pred_attn_engine = pred_dict['pred'].flatten()
# Plot LSTM only
plt.figure(figsize=(10, 4))
plt.plot(cycles, pred_lstm_engine, label='LSTM')
plt.axhline(0.5, color='red', linestyle='--', linewidth=0.8, label='Threshold')
plt.title(f'LSTM Distress Prediction for Engine {unit_id}')
plt.xlabel('Cycle')
plt.ylabel('Distress Probability')
plt.legend()
plt.tight_layout()
plt.savefig("lstm_engine_prediction.png")
plt.close()
# Plot LSTM + Attention only
plt.figure(figsize=(10, 4))
plt.plot(cycles, pred_attn_engine, label='LSTM + Attention')
plt.axhline(0.5, color='red', linestyle='--', linewidth=0.8, label='Threshold')
plt.title(f'LSTM + Attention Prediction for Engine {unit_id}')
plt.xlabel('Cycle')
plt.ylabel('Distress Probability')
plt.legend()
plt.tight_layout()
plt.savefig("lstm_attention_engine_prediction.png")
plt.close()
# Combined comparison
plt.figure(figsize=(10, 4))
plt.plot(cycles, pred_lstm_engine, label='LSTM')
plt.plot(cycles, pred_attn_engine, label='LSTM + Attention', linestyle='--')
plt.axhline(0.5, color='red', linestyle=':', linewidth=0.8, label='Threshold')
plt.title(f'Engine {unit_id} – LSTM vs Attention')
plt.xlabel('Cycle')
plt.ylabel('Distress Probability')
plt.legend()
plt.tight_layout()
plt.savefig("comparison_lstm_vs_attention.png")
plt.close()
print("Engine-specific visualizations complete.")


